Skip to Content

Cutting the cord

What cancelling VNI-West means for the energy market and the future power system

VNI-West sits in the forward plan for the NEM, but its future is now uncertain. It has been the subject of a long and difficult public debate about cost, route and land use, and there is a live possibility that the project does not proceed. Most of the analysis published on the project to date has been directed at the explicit cost of the project. Comparatively little has been directed at what the world looks like with and without the project, and in particular the key question: what does the power system look like without VNI-West and what must happen in its place?

Against this backdrop, in this article we consider a range of projections to improve our understanding about the consequences of the project not proceeding. We do not seek to express views on the non-quantitative merits of the project, on whether its costs are reasonable, on the land use and social licence questions along the route. Those are matters to which a model has nothing useful to contribute. What a model can do is trace the consequences for the power system, the electricity market, and the broader energy system.

We take our reference case for the NEM, remove VNI-West, and consider what happens when we do nothing, or when we allow the model to re-optimise the generation and storage build in response. We consider three questions:

  • What happens to prices, in Victoria and elsewhere?
  • What does the system build instead?
  • What does that build do to gas consumption?

The short answer is that the price effect is large and it persists, the system does not really replace the interconnector so much as run a more expensive version of itself without it, and the difference is accounted for by increased consumption of gas for power generation.

Where the project stands

VNI-West entered the 2022 ISP as a staged actionable project. AEMO Victoria Planning and Transgrid published the PACR in May 2023, identifying a 500 kV double-circuit line from Bulgana on the Western Renewables Link to Dinawan on Project EnergyConnect as the preferred option. AEMO ran the feedback loop against the 2023 IASR and the Draft 2024 ISP in December 2023 and confirmed the project remained on the optimal development path, and the AER approved the Stage 1 early works contingent project application in May 2024.

The project has been retained as actionable in the 2024 and 2026 ISPs. Over that period the Victorian route has moved, the delivery vehicle has changed, and the cost estimate has risen from a little under $4.0 billion at the time of the Stage 1 application to $7.6 billion in the 2026 ISP, carried with an accuracy range of minus 30 to plus 50 per cent.

Our method

We start from our headwinds reference case for the NEM and construct three cases for comparison.

  • The first is the base case, with VNI-West delivered on its current timing in our reference case. Importantly, our reference case already assumes delays to VNI-West.
  • The second is the naive removal case. We take VNI-West out of the forward plan and change nothing else – the same generation and storage build, in the same places, at the same times. This is deliberately artificial.
  • The third is the re-optimised case. We take VNI-West out and let the model rebuild: generation, storage and firming are all free to respond, subject to the same build limits and connection constraints as the base case.

We report outcomes on our standard weather reference year, but also for some charts on a 2011 weather reference year. The 2011 reference year combines a harsh summer with a winter that sees sustained wind droughts across the southern states. Chart 2 explains why the choice of reference year does a great deal of the work in this analysis.

Chart 1 – The naïve price effect in Victoria, and how long it lasts

Chart 1 shows average annual spot prices in Victoria for the reference case and the naïve case without VNI-West. The two cases are indistinguishable to FY2033. They separate in FY2034, and by FY2036 the case without VNI-West is at $194 per MWh against $126 in the reference case. From that point the gap averages around $56 per MWh and never closes. It is at its widest in FY2036 and again in FY2044, at close to $70 per MWh, and at its narrowest in the mid-2040s, at around $40. In the last year of the outlook it is still $38.

Chart 1 – Removing VNI-West lifts Victorian prices by around $56 per MWh from FY2036

Average annual spot price in Victoria, reference case versus reference case excluding VNI-West
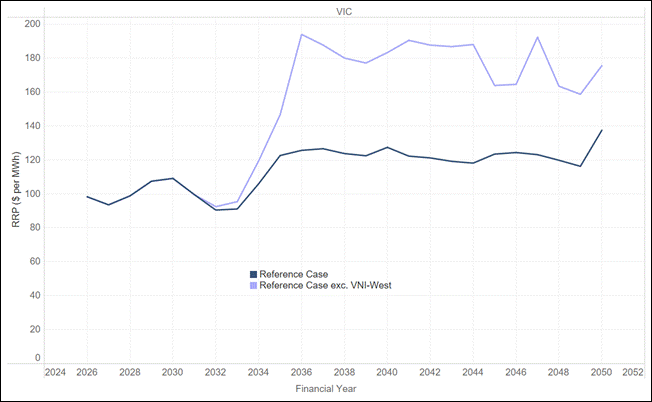
Chart 2 – Outcomes under a 2011 weather reference year

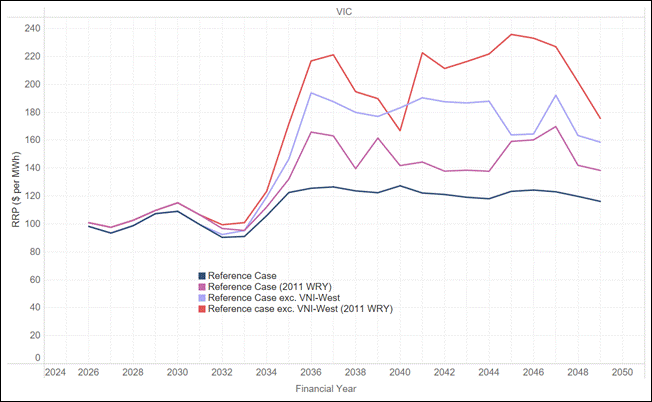
Chart 2 adds a 2011 weather reference year to both cases, giving four lines: the reference case and the case without VNI-West, each run on standard weather and on the 2011 trace. The price level rises sharply. Without VNI-West, a 2011 trace produces Victorian prices above $210 per MWh in six years of the outlook and a peak of $236 per MWh in FY2045, against $124 in the reference case on standard weather in the same year.

Chart 2 – Under a 2011 reference year the removal effect is markedly greater

Average annual spot price in Victoria, standard weather and 2011 weather reference year
An interconnector earns its keep on a small number of days a decade, under exactly the conditions the 2011 trace reproduces, because that is when the diversity between regions is doing the heaviest lifting. Averaging across reference years does to an interconnector what averaging across a year does to a peaker: it produces a number that is arithmetically correct and analytically useless.

We made a version of this point in our November 2021 Chart of the Month on Vic-NSW. Interconnectors derive a large part of their value from the uncertainty of future outcomes, because they increase the diversity of supply options, and yet the models used to value them are typically deterministic and assume perfect foresight. If we know the future, there is no value in a hedge against uncertainty. Five years on, the models have improved at the margin, but the point still stands.

Chart 3 – This is not just a Victorian question

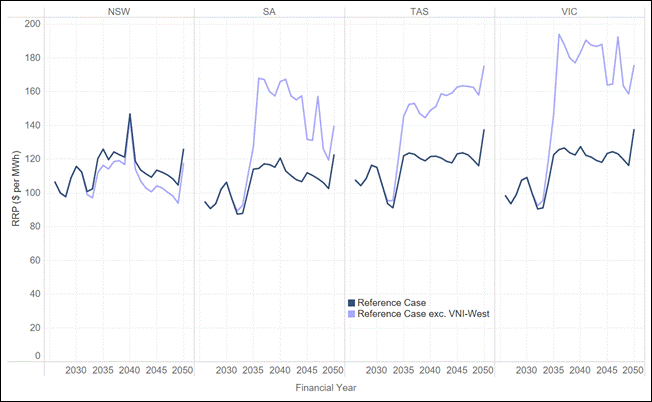
Chart 3 shows the same comparison across four regions. South Australia is affected almost as heavily as Victoria. Prices without VNI-West run around $50 per MWh above the reference case from FY2036 through to the mid-2040s, peaking near $168 per MWh in FY2036 against $114. Tasmania is $30 to $45 per MWh higher over the same period. New South Wales moves the other way: from the early 2040s, prices there sit some $5 to $12 per MWh below the reference case, because energy that would have moved south stays in the region.

Chart 3 – South Australia and Tasmania bear price increases nearly as large as Victoria

Average annual spot price by region, reference case versus reference case excluding VNI-West
The mechanism is not complicated, but it is routinely missed. Interconnectors also affect prices in neighbouring regions, sometimes for the better and sometimes for the worse. The practical consequence is that the effects of the decision are not restricted to Victoria, and they are not symmetric. A change of $50 per MWh in South Australia is not a rounding error.

Chart 4 – What the system builds instead

We now turn to the re-optimised case. Chart 4 shows the difference in new capacity between the base case and the re-optimised case by technology and year. Bars above the line are capacity the reference case builds but the removal case does not; bars below the line are capacity built only in the case without VNI-West.

The first thing to say is that this is not a replacement. Without the network, the renewables cannot be delivered, so the model does not build them. It builds a smaller, more gas dependent fleet and runs it harder.

Chart 4 – The system does not replace VNI-West. It substitutes gas peaking and deep storage for VRE

Difference in new capacity by technology and financial year, reference case less case excluding VNI-West
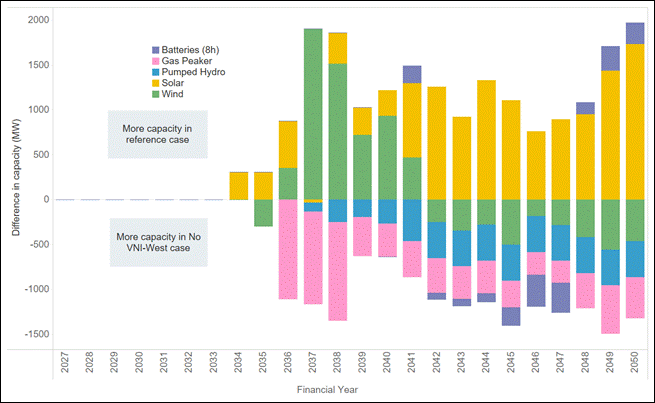
Underneath the total there is a clear substitution. Through FY2036 to FY2038 the reference case builds around 1.5 GW a year more solar and wind, while the removal case brings forward roughly 1.2 to 1.5 GW a year of gas peaking. The pattern continues with more gas and deep storage replacing more wind and solar. Interestingly the No VNI-West case builds materially more pumped hydro as it tries to firm a system that no longer has a second path to New South Wales.

The replacement is not like-for-like in either technology or location: it is gas peaking and deep storage in place of solar, wind and network, sited to reach load on the existing system rather than to reach the resource.

Chart 5 – The consequences for prices under the re-optimised case

So what does this mean for prices. Chart 5 shows the same analysis as Chart 3 but now includes prices for the re-optimised case. The important point here is that the price increases associated with the new build case persist. The reason for this is the increased use of gas for power generation in the Southern states.

Chart 5 – Even with re-optimisation the price increases persist in Victoria and Tasmania

Average annual spot prices, reference case versus re-optimised and reference case excluding VNI-West
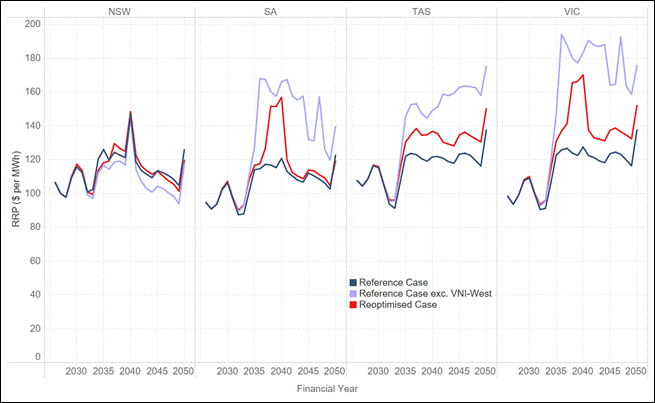
Chart 6 – The consequence for gas under the re-optimised case

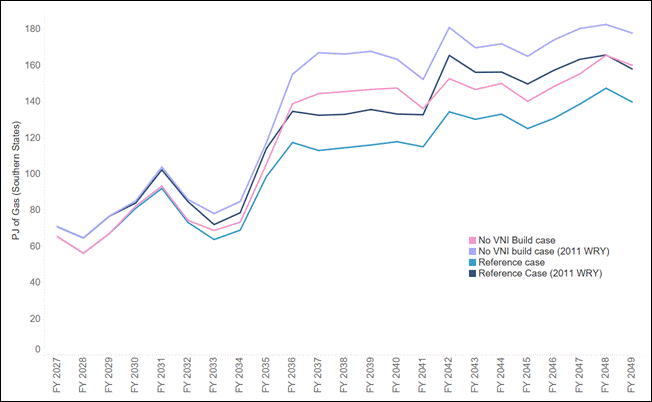
Chart 6 shows gas consumption for electricity generation in the Southern States across all four cases: reference and re-optimised, each on standard weather and on the 2011 trace. Gas burn rises by roughly 20 to 28 PJ a year from the mid-2030s onwards, an increase of between a third and a half on the reference case. The divergence opens in FY2035 and, like the price effect, does not close. The extreme weather year is when the system most needs gas, and removing the interconnector also raises the requirement.

Chart 6 – Southern states’ gas consumption rises by 25 PJ a year, more under a 2011 reference year

Gas consumption for GPG in Southern States, 2015 and 2011 weather reference years
The southern gas market is already tight. Southern supply has been declining faster than southern demand for some years, the balance is met by northern gas moved south through pipeline capacity that is fully subscribed on peak days, and it is peak-day capability rather than annual quantity that binds.

We cannot be certain whether that gas can be delivered, because much can happen in the domestic market between now and the 2030s. But we can say that it is one of the questions on which the removal case turns.

Our two cents

  • The system does not replace VNI-West, it substitutes for it, and the substitution is worse. We expected the model to build its way back to something close to the reference case outcome and it does not. It leans on gas peaking and deep storage, and leaves Victorian prices around $20 per MWh higher for the rest of the outlook. Removing an asset like this from the forward plan is not a decision to avoid a capital cost. It is a decision to accept a permanently more expensive system unless something cheaper is put in its place.
  • The price effect does not fade, which is unusual and which changes how the decision should be framed. In most of the work we do, a shock to the system produces a transitional price effect that closes once the build catches up. Here the build has fifteen years to catch up and does not. We are removing a key piece of strategic infrastructure from the grid. A decision framed as a saving of $7.6 billion in capital is, on these results, a decision to add tens of dollars per megawatt hour to southern prices indefinitely.
  • The value of a line like VNI-West is the value of an option, but we keep measuring it as though it were a pipe. Chart 2 is revealing – the value under the 2011 weather year is markedly higher than under a median year. The value is concentrated in the tail events, and a framework that prices interconnectors on median outcomes across a scenario weighting will underprice it in a way that is superficially rigorous. This is a general problem with how we (as an industry) value network assets – not a feature of VNI-West.
  • The effects are national and they are not symmetric. South Australia carries an increase of up to $30 per MWh and Tasmania up to $20 per MWh, while New South Wales is slightly better off. This shows that this is not just an issue for Victoria, but rather a consideration for all the Southern states.
  • The benefit of planning certainty is itself an input to cost, and it does not appear anywhere in a RIT-T. A developer looking at any future transmission project has to price the probability that the project is unwound before it is delivered, and that probability is now visibly non-zero. A forward plan that is revisited whenever costs move or circumstances change raises the risk premium on every project that it comprises, and that premium is paid by consumers.
  • Applied consistently across all future transmission projects, the RIT-T and ISP framework that has been applied to VNI-West would ultimately dispose of most of the forward transmission plan. Every major line has the same profile: costs that escalate between the PACR and the final estimate, and benefits concentrated in tail years that the central case dilutes. If that combination is sufficient to remove a project from the plan, the same logic reaches into every other major transmission project. A counterfactual worth modelling is one in which the sector builds very little new transmission at all, and each region solves its problem locally with gas. That is a coherent system with an estimable cost, and we should estimate it rather than arrive at it by accident, one project at a time.

About Endgame

Endgame Analytics is an economic and mathematical consultancy that specialises in energy. We bring expertise in optimisation, quantitative analysis, and critical thinking to solve complex problems.
VNImby

Highlights from the Australian market

News from Japan

  • Itochu (major Japanese trading firm) will be entering the data centre business and aims to develop up to 10 data centres by 2030: 伊藤忠がデータセンター参入 数千億円投じ10棟開発、JR東と協業視野 Each site will be ~50 MW in size, and the investment capital for the 10 data centres to be developed is estimated to be several-hundred billion yen (several billion AUD). As data centres require large plots of land, Itochu is planning on partnering w/ JR East (major train company) which holds strategic lots of land across the Greater Tokyo and Eastern Japan.
  • JAPEX (major Japanese petroleum exploration firm) is now driving a 2nd pile underground to conduct geological survey for potential CO2 sequestration in Tomakomai City, Hokkaido: 石油資源開発、CO2地下貯留に向け試掘2坑目 北海道苫小牧で
  • Tomakomai has Japan’s largest industrial area aptly called Tomatoh (“eastern Tomakomai”), where various trials are being conducted such as CCS / CO2 sequestration and hydrogen/ammonia co-firing, alongside existing thermal power plants: 日本最大の産業地域「苫東」:TOMATOH―苫小牧東部地域 産業用地―
  • Kansai EPCO says that at its Oi nuclear plant Unit 3 (1.18 GW), which has been shut down since last week due to the loss of magnetic field generation for the turbine, a part called a “diode module” broke apart, most likely due to wear-and-tear: 停止中の大飯原発3号機、部品に損傷 異常警報で関西電力が調査 The diode module was installed in 1991 and hasn’t been replaced since then (so it was over 35 years old).
  • Japan’s Ministry of Agriculture, Forestry and Fisheries (“MAFF”) is proposing new legislation for agrivoltaics to have a max shading rate of 30%: Japan’s proposed shading rate for agrivoltaics is unreasonable, says think tank Public comments are to be submitted by 22nd Aug, w/ the proposed legislation to be implemented from Sep-end onward. Developers as well as think tanks such as the Renewable Energy Institute (“REI”; for some reason in the English article they call it the Renewable Energy Foundation) have voiced concerns that implementing a “non-scientific” arbitrary threshold of 30% for the shading rate would be detrimental for the agrivoltaics industry.

Podcast of the week

In the debut episode of Zugzwang, Oliver and Jack tackle the perception that market modelling is an impenetrable black box and start pulling it apart. 

Listen now on your favourite podcast platform:

Spotify: https://open.spotify.com/show/0346ILtbXgKJJIlOy64p1i

Apple Podcasts: https://podcasts.apple.com/us/podcast/zugzwang/id6801348317

YouTube: https://www.youtube.com/playlist?list=PLQ3gvq2Ccils

You say Tomaygo and I say Tomahgo

Highlights from the Australian market

News from Japan

Podcast of the week

Zugzwang: The Market Modelling Podcast. The energy sector has been asking for this. Zugzwang is Endgame Analytics’ new podcast digging into market modelling, from Oliver Nunn and Jack Simpson.

The name comes from chess, a position where any move you make leaves you worse off. It’s hard to pronounce and a little pretentious, and that’s exactly the point.

Episodes launching next week. Subscribe and listen to the teaser here: https://open.spotify.com/show/0346ILtbXgKJJIlOy64p1i?si=77a682128e1c4836

Commonwealth records

Highlights from the Australian market

News from Japan

  • The M7.1 Kumamoto earthquake on 28 July cut power to about 32,000 households in Kumamoto Prefecture at its peak, with around 14,000 still off supply two days later; gas supply remains suspended in parts of the prefecture, mobile generator vehicles have been deployed to run air conditioning at evacuation centres in 35°C heat, and the Sendai nuclear plant about 100 km from the epicentre reported no abnormalities.
  • Paywalled: Invenergy has shelved its planned 47.3 MW onshore wind project near Hakodate in Hokkaido three months after announcing it, after residents objected over soil erosion, water contamination and low-frequency noise. An online petition drew more than 30,000 signatures ending an 11-turbine project that was to begin construction in 2031 and reach commercial operation by 2035.

Podcast of the week: Catalyst’s Shayle Kann on the commercial battery comeback – why C&I storage has been the missing middle, and what’s finally shifting the economics.

Lithium high

Highlights from the Australian market

Podcast of the week: Bloomberg’s Switched On discusses data centre developers turning to on-site gas turbines to bring AI data centres online faster than grid connections allow.

Data Centres – Generally Costly

Highlights from the Australian market:

Some news from Japan:

  • Japan Nuclear Fuel Limited’s Rokkasho-mura reprocessing plant in Aomori Prefecture looks set for a 28th delay, after the Nuclear Regulation Authority ordered that nuclear waste material currently on-site be processed and removed before completion, rather than afterward as originally planned.
  • Japan’s eight major regional power companies plan to upgrade or build 30 substations nationwide by the early 2030s, adding over 15 GW of grid capacity to meet AI-driven data centre demand.

Podcast of the week: Let Me Sum Up dives into the 2026 Integrated System Plan and a new energy governance report.

Wind woes

In this Weekly Dispatch:

  1. South Australia experienced its worst wind drought in seven years, with prices hitting the market price cap twice and gas surging from under 5% to more than 50% of generation.
  2. Firmus has signed a 12-year, 600 MW wholesale energy supply deal with commodities trader Gunvor to power its planned South Australian AI Factory campuses, with Gunvor backing 1.2 GW of new renewable generation and 1.5 GWh of battery storage by 2032.
  3. WA has launched consultation on its Future Energy System Outlook (FESO), a scenarios-based study out to 2050 for the South West Interconnected System.
  4. The Australian Energy Regulator has formally separated from the ACCC to become a standalone Commonwealth entity from 1 July, gaining direct control of its own staffing and corporate services while its regulatory functions and independence remain unchanged.
  5. South32 has agreed to sell its aluminium value chain (including Worsley Alumina in WA, Hillside Aluminium in South Africa and three Brazilian assets) to Alcoa for up to US$5.6 billion, as it refocuses on copper, zinc, silver, lead and manganese.
  6. None of China’s major battery makers have yet received Japan’s JC-STAR cybersecurity certification, which will be required for grid-connected BESS and solar/wind equipment from FY2027, fuelling concerns the scheme is a de facto China-exclusion tactic.
  7. TEPCO has confirmed its total ¥100 billion (~AUD 900 million) community payout to Niigata Prefecture tied to the restart of its Kashiwazaki-Kariwa Unit 6 (1.36 GW).
  8. Podcast of the week: Bloomberg’s Switched On — “Battery Boom Is Upending Australian Power Market Rules”, on how Australia’s battery boom is eroding the arbitrage returns that drove its early growth.

Socceroo-newables

In this Weekly Dispatch:

  1. AEMO has released the 2026 Integrated System Plan, reaffirming renewables firmed by storage and backed by gas as the least-cost path as coal retires, with NEM consumption forecast to nearly double and a 35 GW home battery fleet expected by 2050.
  2. AEMO has published the 2026 WEM Electricity Statement of Opportunities, finding that coordinated home batteries are already flattening WA’s evening peak and are expected to reduce grid-scale investment needs by 2028-29, with data centres appearing as a separate demand category for the first time.
  3. The Australian Government has announced CIS Tender 8 results: 15 BESS projects totalling 4.2 GW/16.1 GWh were awarded, marking the second consecutive technology-neutral dispatchable tender where every winning bid was a battery.
  4. The Queensland 2026-27 Budget confirms the government will continue progressing Borumba Pumped Hydro and conduct further investigations into the Capricornia pumped hydro project in Central Queensland.
  5. The AEMC has commenced its Electricity Network Regulation Review, including consideration of a rule change request from Energy Networks Australia to allow distribution networks to install and operate kerbside EV charging infrastructure as a regulated service.
  6. JERA (Japan’s largest thermal generator) has announced it will build a 1 GW-scale LNG-fired power plant in the central U.S. for about US$3 billion, co-located with a data centre, with a target COD of 2028.
  7. With Middle East LNG disruptions pushing up fuel costs, JERA is considering offering multi-year coal-fired PPAs to retail electricity providers, reversing recent years where its coal output was sold mostly into the spot market.
  8. Bonus: The Socceroos qualify for the 2026 World Cup knockout round after drawing 0-0 with Paraguay.
  9. Podcast of the week: Our very own Hayato Ono features as a guest on the Japan Energy Podcast – Ep #3: The BESS Market: Hype vs Reality.

Milking it

In this Weekly Dispatch:

  1. The AEMC’s final pricing review recommends shifting tariff complexity off household bills and onto retailers — pricing electricity “like milk” — while flagging up to $6 billion in network savings by 2040 and forcing retailers to disclose loyalty penalties.
  2. Transgrid is asking the AER to recover roughly $1.1 billion of its $1.5 billion EnergyConnect blowout from consumers, after the NSW interconnector’s cost increased from $1.8 billion to $3.6 billion.
  3. Singapore-based Firmus is on track to become Tasmania’s single largest electricity user, with AI factories proposed across Launceston, Bell Bay and Wesley Vale targeting up to 400 MW — as much as 15% of state supply.
  4. The AER has granted five-year trial waivers letting VIOTAS and Enel X enrol large multi-site industrial loads in the Wholesale Demand Response Mechanism, testing whether flexible demand can ease peaks and defer grid investment.
  5. Western Power has begun building 18 community batteries across Perth and Bunbury — 6.6 MW combined, part-funded by ARENA — to soak up rooftop solar and discharge into the evening peak.
  6. Hyundai has completed Australia’s first V2G discharge using the ISO 15118-20 standard, pairing an IONIQ 9 with a CEC-listed StarCharge bidirectional charger as ARENA forecasts up to 2.6 million V2G homes by 2040.
  7. The Bureau of Meteorology has confirmed El Niño is underway, with the Niño3.4 index at +0.92°C — above its +0.80°C threshold — bringing the BoM into line with NOAA and the WMO and signalling a drier, hotter winter–spring for eastern Australia.
  8. Endgame’s own piece, republished on WattClarity, argues the NEM’s deterministic planning hides tail risk and that the ESOO is no longer fit as a resilience instrument — making the case for stochastic modelling, stress-testing and wargaming.
  9. INPEX is launching a commercial trial of blue hydrogen power generation in Niigata, with first electricity sales due mid-June from a 1 MW turbine made by Germany’s 2G — hydrogen made from domestic natural gas, with the CO₂ sequestered in a depleted nearby gas field.
  10. Podcast of the week:  Let Me Sum Up chat about the Domestic Gas Reservation Scheme draft Design Framework, which is out for consultation.

Confronting the stochastic reality of the National Electricity Market to avoid planning blind spots

1. Confronting stochastic reality in the NEM to avoid planning blind spots

The way we plan the National Electricity Market (NEM) rests on a quiet assumption: that a handful of carefully chosen, deterministic input traces can stand in for a system that is, in reality, profoundly variable. Demand, weather, plant availability, gas use and price do not arrive as single, knowable numbers, they arrive as distributions. When we collapse those distributions to a central case and plan to it, we are not planning to reality. We are planning to an average the system may rarely, if ever, actually experience.

The danger is not that the central case is wrong. It is that everything around it, the tails, the compounding, the bad weeks, is precisely where reliability is won or lost, and a deterministic frame renders all of it invisible. This article makes three arguments:

  1. That the inputs to our models are stochastic, so their outputs must be too.
  2. That a system built to the average is not resilient to shocks without exposing itself to unserved energy.
  3. That new tools, deliberate stress-testing and wargaming, backed by reform of the frameworks and the culture that commission them, can close these blind spots without throwing away what already works.

2. Modelling inputs are stochastic, and therefore outputs are stochastic too

Most modelling in the NEM is built on deterministic inputs. A planner selects a demand trace, a set of renewable traces, an outage assumption and a gas trajectory, runs the model, and reads off the result. It is clean and tractable, and it is not reflective of the system we actually operate. Demand, renewable output, forced outages, gas consumption, price and, ultimately, reliability are all stochastic. Each is better understood as a range of plausible outcomes than as a single line.

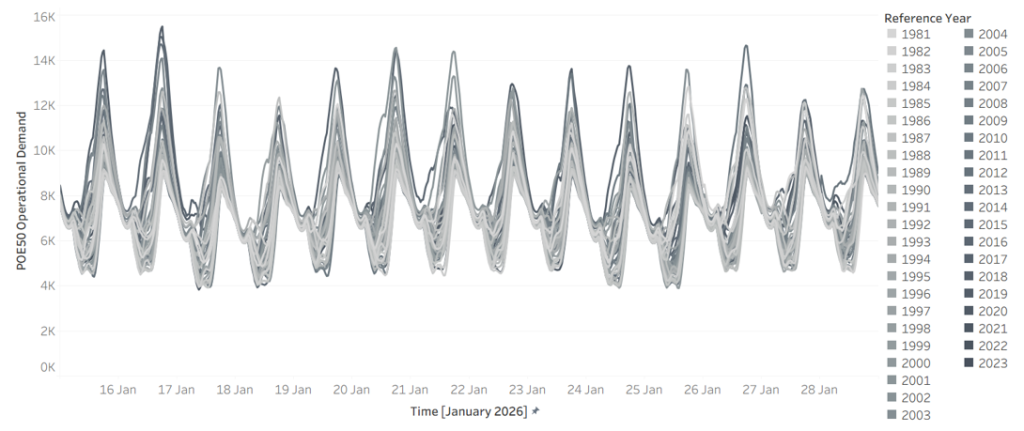
Start with demand. Figure 1 shows modelled NSW demand for a single fortnight, 15 to 28 January 2026, drawn across 45 weather reference years. The same calendar dates produce a wide envelope of outcomes depending only on which historical weather pattern is overlaid. A hot year sits well above a mild one, there is no single “January demand”, only a distribution of it.

Figure 1 – Demand in 2026 for NSW across 45 weather reference years (x-axis 15 January to 28 January, y-axis NSW demand)

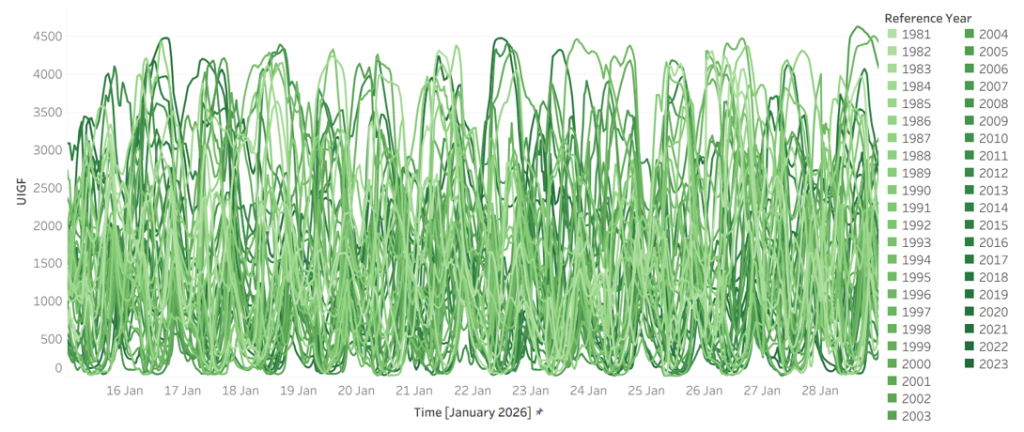
Weather is the driver, and it is at least as variable. Figure 2 shows Victorian wind generation over the same fortnight across the same 45 reference years. Output swings from near-zero to abundant over identical calendar dates, year to year. The combinations matter more than any single series: the years that deliver low wind are not always the years that deliver mild demand, and it is when high demand and low wind coincide that the system is most exposed.

Figure 2 – Wind in 2026 for Victoria across 45 weather reference years (x-axis 15 January to 28 January, y-axis VIC Wind)

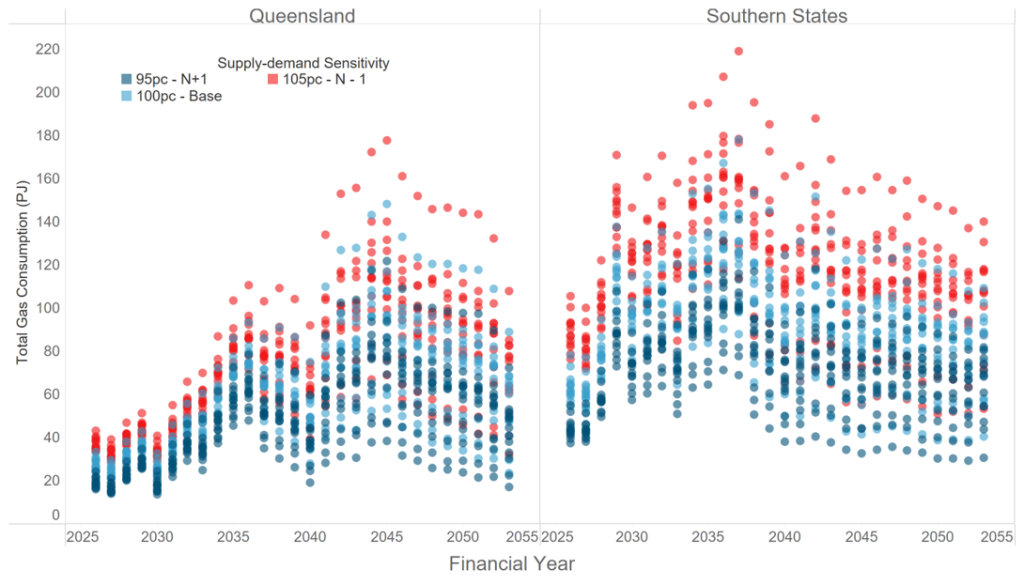
That variability propagates downstream. Figure 3 shows total gas consumption by gas-powered generation (GPG) by financial year, across reference years and under demand sensitivities of 95%, 100% and 105%. The spread is wide, and unsurprisingly so. GPG is the system’s reserve capacity, called on most heavily exactly when renewables are short and demand is high, so its consumption inherits and amplifies the variability sitting above it.

Figure 3 – Total gas consumption by GPG across reference years and supply sensitivities

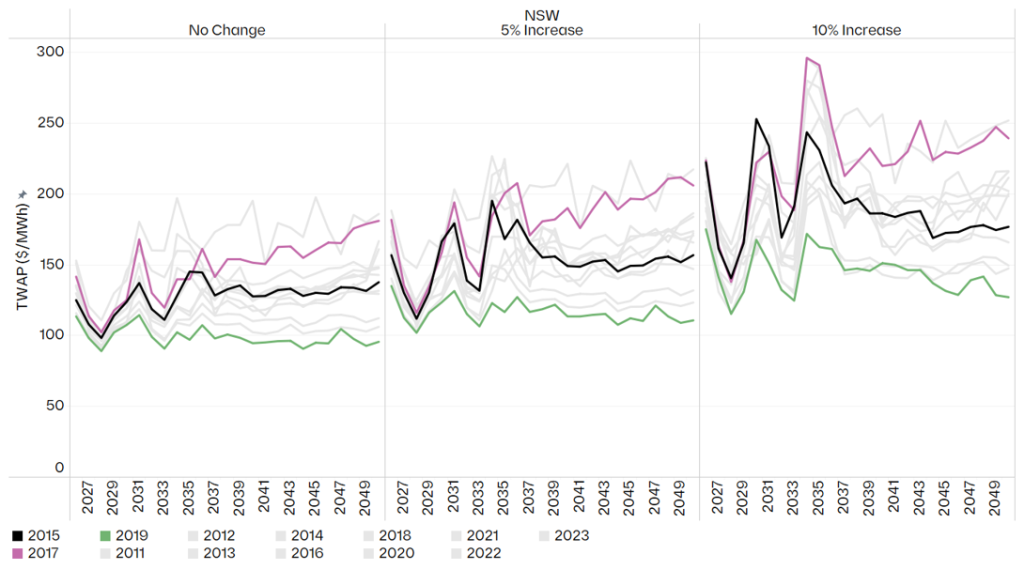
If the inputs are stochastic, the outputs cannot be anything else. Figure 4 makes this concrete: annual time-weighted average price (TWAP) in NSW under the Endgame Headwinds scenario, by weather reference year and under demand increases of 0%, 5% and 10%. A single deterministic run returns one number from this distribution, and, crucially, tells you nothing about how wide the distribution around it really is.

Figure 4 – Headwinds annual TWAP ($/MWh) in NSW by weather reference year and demand sensitivity

A deterministic model does not produce a wrong answer, it produces one draw from a distribution it never reveals. Two planners working from defensible but different central assumptions can arrive at materially different prices, dispatch patterns and reliability outcomes, with nothing in either result to signal how much sat unexamined in the tails.

3. A system built to the average is not resilient to shocks with unserved energy

The Integrated System Plan (ISP), the document that frames two decades of investment, uses a rolling reference year approach. It is a reasonable way to keep a twenty-year model tractable, but by construction it does not account for the stochastic nature of the NEM, and it tends toward a central, expected trajectory. That should prompt three uncomfortable questions. What does an average-based plan hide about how the system actually behaves? What does it tell us about the true shape of the operating envelope? And what does it tell us about resilience?

The honest answer to all three is: not enough. Averaging smooths away the very combinations that decide reliability, the simultaneous hot, low wind, high-outage conditions that seldom appear in a central case but routinely appear in the tails. A plan calibrated to the middle of the distribution can look entirely adequate while leaving no headroom for the adverse-but-plausible week.

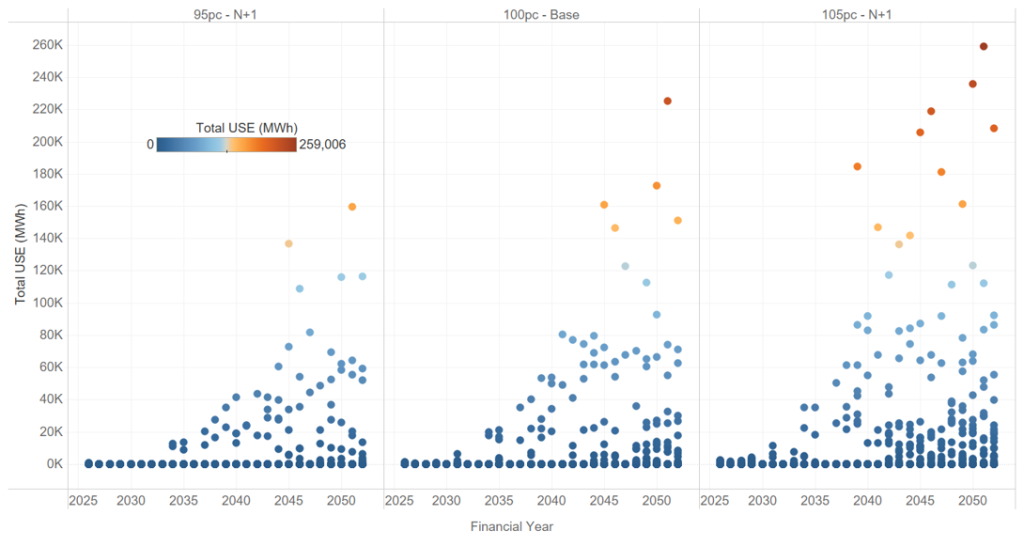
Figure 5 shows what surfaces when you look across the distribution rather than at its centre: projected unserved energy (USE) in NSW under the Endgame Sunny Side Up scenario, across 13 weather reference years and three demand sensitivities. In many years and sensitivities, USE is negligible. In others, it is not. A system that looks reliable on average can carry real unserved energy risk once the full spread of weather and demand it must withstand is accounted for, and that risk is invisible to any single central run.

Figure 5 – Projected USE in NSW for Sunny Side Up scenario across 13 weather reference years and 3 demand-supply sensitivities.

This is why “build to the average” is a dangerous frame. What keeps the lights on in a bad year is not the average outcome, it is the headroom the system carries against the tail. A plan that optimises to the centre will, almost by definition, treat that headroom as surplus and strip it out. The implication is uncomfortable but hard to avoid: the Electricity Statement of Opportunities (ESOO), in its current form, is no longer fit for purpose as a resilience instrument. A framework anchored to a narrow band of demand probabilities and weather years cannot characterise the risks that live in the tails, and those risks are exactly what we most need to understand.

4. New tools, wargaming and stress testing can greatly improve existing frameworks

None of this is an argument for discarding the ISP or the ESOO. The discipline they impose is real and worth keeping. We see the task in four parts: designing better studies, building the capability to run them, reforming the institutions that commission them, and breaking the culture that has held all three back.

The first shift is in how the studies themselves are designed. Too much is currently assumed away in the name of tractability. A more honest approach would:

  1. Look much further into the future, to the system we are committing to deliver, not the system we have. The consequential question is whether the fleet we are spending billions to build will hold up under the weather and demand it will eventually face.
  2. Characterise the full distribution of outcomes, moving beyond POE10 and POE50 demand traces and the handful of weather years that conventionally underpin reliability assessments, and drawing on much larger weather datasets.
  3. Treat unit commitment and system security as part of the study, not an afterthought. Having enough energy on paper means little if the system cannot be operated securely when conditions are at their worst.
  4. Bring gas demand and gas constraints inside the analysis. Gas-powered generation is the reserve capacity the system leans on in precisely the conditions that produce unserved energy, yet gas supply and transport limits are too often left at the edge of the model.
  5. Deliberately try to “break” the system, actively hunting for the weaknesses and holes in the current approach, rather than assuming away the tough questions because they are inconvenient.

We can change our current planning frameworks using:

  1. New tools. We need models that can be run faster, more cheaply and at far greater scale, so that exploring thousands of plausible futures becomes routine rather than exceptional. The combinatorics of weather, demand and outages cannot be brute forced with tools built for a handful of deterministic runs.
  2. Wargaming. Borrowing from the security world, ‘blue team / red team’ exercises are a powerful device: one team is tasked with finding ways to break a future system, while the other works to remedy the weaknesses they expose. The adversarial structure uncovers failure modes that a single, consensus seeking study tends to overlook.
  3. Stress testing. The aim is not only to ask whether a system is reliable, but to work out what it would take to break it. Knowing the distance to failure, and the conditions that get us there, is far more useful for decisions than a single pass/fail verdict against a central case.

5. Reforming the frameworks and the institutions

Better methods will not stick unless the regulatory framework asks for them, and two reforms stand out.

The first is to overhaul the ISP so that its centre of gravity shifts from transmission to the viability of the system as a whole. The process should assess future system needs and how the system will actually be operated, answering questions such as what the gas system will need to provide, what the system security requirements are, how the system will be operated through difficult periods, and what margin of safety is required to deliver adequate outcomes for society.

The second is to stand up an independent panel to stress test the system. A standing panel of industry experts should run stress testing and wargaming exercises on an annual basis. To keep them free from political interference, the exercises themselves should not be public, but the panel should publish a public facing report setting out its findings and recommendations. That structure preserves candour while keeping the conclusions accountable.

6. Breaking the groupthink

Underneath the technical and regulatory questions sits a cultural one. The current lack of innovation in how we model the future power system has produced a textbook case of groupthink: the same findings are confirmed again and again, and the ISP and ESOO processes are so heavily regulated that there is little room to do anything differently. The result is a planning conversation that mostly reinforces its own assumptions. Escaping it will take a governance structure that actively rewards new approaches rather than penalising those who depart from the consensus.

The NEM is becoming more weather dependent, not less. As thermal capacity retires and variable renewables and storage take its place, the gap between the average year and the bad year will only widen, and so will the cost of planning blind to it. The reasonable response is not to model the world as simpler than it is, but to confront its variability head-on: to treat stochastic inputs as stochastic, to plan for the distribution rather than its midpoint, and to build the margin of safety that resilience demands. This all starts with stochastic thinking.

Authored by: Kevin Yang, Matthew Bungate and Oliver Nunn

a.
Level 31, 9 Castlereagh St, Sydney NSW 2000

Oops! We could not locate your form.

Get in touch.