NSW is letting gas into its renewables scheme, with ASL consulting on a firming LTESA tender designed specifically to support gas-fired plants, a sharp contrast to the federal Capacity Investment Scheme, which excludes gas.
ASL’s 2026 Firming IIO Report sets a 1,500 MW pathway for new NSW firming capacity by May 2033 to cover the retirement of Bayswater and Vales Point, with projects needing to deliver for at least eight hours and a first tender due in 2027.
Victoria has given final state approval to WestWind Energy’s 1.5 GW Warracknabeal Energy Park, a 219-turbine wind farm with two 300 MW batteries that would be the largest in the Southern Hemisphere, though critics warn it depends on transmission lines like VNI West and the Western Renewable Link that are far from built.
The Climate Council warns coal and gas miners are using a Safeguard Mechanism loophole, classing projects as expansions rather than new facilities to avoid stricter best-practice limits, which it estimates will add 4.5 Mt of CO2 a year by 2035.
A new ACCR report argues WA doesn’t need Woodside’s Browse project to avoid a domestic gas shortfall from 2030, since exporters could supply more from existing projects, a claim rejected by Woodside, industry veterans and the Cook Government.
SA Energy Minister Tom Koutsantonis has hinted for the first time that SA may miss its 100% net renewables target for 2027, possibly slipping into 2028, after delays to the SA–NSW interconnector stalled new wind investment, though the state’s pipeline is now rebounding to nearly $32.5 billion of projects under construction or approved.
Endgame Analytics’ latest whitepaper puts Byron Bay under the microscope. Using connected vehicle data from Compass IoT, we modelled what an extra 6,000 visiting EVs would mean for peak demand on the local substation.
The case study looks at a peak visitor day, when around 40,000 visitors join the town’s 11,500 residents, and assumes half of all visiting vehicles are electric.
Zugzwang: Episode 5 – Networks, power poles and the EV charging gap
The latest episode of Zugzwang: The market modelling podcast is now available!
Jack Simpson and Oliver Nunn are joined by Endgame Director Martin Chow and Russell Pendlebury, General Manager of Regulation and Policy at Energy Networks Australia, to dig into proposed rule changes that would let networks install curbside EV chargers on ordinary suburban power poles, and what it means for equity, network costs and bills.
The High Court has dismissed MACH Energy’s appeal, keeping its Mount Pleasant coal mine expansion on hold after ruling the NSW planning commission should have considered the emissions from burning the mine’s exported coal overseas.
Wagga Wagga residents have launched a petition against CDC’s proposed $15 billion, 1.4 GW data centre, which is expected to use as much electricity each year as 1 to 1.5 million NSW homes.
Tesla and major energy retailers are fighting a proposed “EV charger tax” that would let grid operators install EV chargers on their power poles and recover the cost from all electricity customers, including people who don’t drive EVs.
Nvidia-backed AI data centre builder Firmus has pulled its $44 billion ASX float, which would have been the biggest since Telstra, after investors balked at its valuation and debt levels.
To tax or not to tax EVs (ABC Business Daily): Carrington Clarke and the e61 Institute’s Amy Tramontozzi explain what surging EV uptake and falling fuel excise revenue mean for the budget and how vehicles on our roads should be taxed.
The government’s Australian Energy Update 2026 shows Australia’s total energy use fell 5% as electric vehicles, rooftop solar and growing renewable generation replace fossil fuels.
Sydney solar retailer Macarthur Energy has collapsed owing $3.4 million to creditors, leaving customers out of pocket by up to $17,600 for batteries never installed and raising questions about consumer protections under the federal Cheaper Home Batteries Program.
Marinus Link has begun its next construction phase with a sod-turning ceremony for the undersea interconnector between North West Tasmania and Victoria’s Latrobe Valley, with the related transmission works due in service by 2030.
News from Japan
Paywalled: Kyushu Electric’s incoming president, Norihiro Nakamura, says the utility is considering building new nuclear capacity, as demand in the region grows from AI data centres and semiconductor hubs such as TSMC’s.
Paywalled: TEPCO is tightening its grid connection rules to stop data centre developers holding queue spots without firm plans; from October 2026, it will cancel requests if the initial construction deposit (10% of estimated costs) isn’t paid within three months, or if development plans change during the application stage.
Movement-driven charging demand and the limits of residential-anchored network planning – a Byron Bay case study
Endgame Analytics is pleased to share the third instalment of our decarbonising transport research series, this time turning to the light vehicle fleet and what happens when a large, mobile block of EV charging demand hits a network sized for locals, not visitors.
We modelled a Byron Bay case study, using Compass IoT connected vehicle data to size what an additional 6,000 visiting EVs would do to peak demand for the local substation. This reflects a peak visitor day, when around 40,000 visitors join 11,500 residents, and assumes half of visiting vehicles are electric. We also test how charger speed and tariff-driven charging behaviour change the result.
Some key highlights:
The peak roughly doubles on convenience charging alone: Against an 11.8 MW summer baseline, 6,000 EVs charging on arrival lift the peak to 23.9–25.1 MW, a 2.0–2.1x multiplier, regardless of charger speed.
Price signals could make it worse, not better: Time-of-use and solar-sharer tariffs synchronise the fleet to commence charging at the same time. On Level 2 (15 kW) chargers, peak demand rises to 91.9 -98.4 MW, 7.8–8.4x the 11.8 MW baseline, against about 25 MW for convenience charging.
Even perfect coordination doesn’t fully solve it: even the theoretical best case lifts the peak to 1.07x the baseline (12.6 MW) at 50% EV penetration, which would be 1.7x the baseline (19.5 MW) if EV penetration reaches 100%.
Pricing alone won’t coordinate this load. Direct load control, dynamic operating envelopes, and recognising the value drivers place on mobility will all need to be part of the answer, alongside the case for network augmentation itself.
Read the full paper here
Fill out the form to download the PDF
Get in Touch
Endgame Analytics are helping clients navigate these interactions between policy, technology, and economic strategy.
Martin Chow, Director (Endgame Analytics) | E: martin.chow@endgameanalytics.com.au
Victoria will ban datacentres from residential zones and within 150 m of homes, schools and childcare centres, and require them to supply their own renewable energy and storage; critics point out that the rules aren’t retrospective, exempting all approved projects and the eight applications already before the planning minister.
With AEMO forecasting that datacentre electricity use could triple by 2030, the AEMC has opened consultation on two rule changes from Minister Bowen that would make datacentres and other large loads pay their share of the network upgrades they trigger, and stop the cost of stranded assets being passed to other consumers if projects fall through. Submissions close 5 November.
Treasury’s Intergenerational Report 2026 names the energy transition as one of five forces reshaping the economy over the next 40 years, projecting that household energy costs will fall around 40% between 2030 and 2050 as homes electrify, and that data centres will make up almost 10% of NEM demand by 2050.
Woodside and Burrup Peninsula Traditional Owners are locked in a $300 million compensation dispute over the 1998 land access agreement for the North West Shelf’s Karratha Gas Plant – the Ngarluma Yindjibarndi Foundation is seeking $390 million over 12 years against Woodside’s offer of $87 million.
Chris Bowen is travelling to India and Saudi Arabia to bolster fuel security, with plans to visit the world’s largest refinery at Jamnagar and meet Saudi Energy Minister Prince Abdulaziz bin Salman about the closure of the East-West pipeline, ahead of COP31.
Sunshine and wind met a record 80.4% of demand on the NEM on Saturday 19th September, with rooftop solar alone supplying more than half the grid’s power for 30 minutes around lunchtime.
Columbia Energy Exchange looks at the Iran war six months on. With crude near $107 a barrel, Hormuz tanker traffic reduced and Saudi Arabia’s East-West Pipeline offline, they warn that the market buffers that cushioned the early shock are running out.
Anthropic has signed a lease for Australia’s largest data centre, the $32 billion Western Downs Digital Park near Dalby in Queensland, which will power Claude AI inference and, once built, draw electricity equivalent to 1.5 million households.
Australia’s dependence on gas generation during the evening peak has fallen by almost 70% in the year to August 2026, with batteries now covering 49% of evening dispatchable power, up from just 0.4% in 2020.
NSW’s renewable transmission delivery agency EnergyCo has underspent its budget by $939 million over the past two years, a symptom of approval delays that now leave the state roughly 7.9GW short of its 2030 renewable energy target.
ARENA has committed $8.2 million to a home electrification trial that aims to make the transition from gas to electricity easier, letting up to 1,000 Canberra households bundle solar, batteries and EVs onto one digital platform.
IEEFA and Green Energy Markets’ Australian Renewable Energy Scorecard finds Australia has enough wind and solar in the pipeline – 34GW of solar and 17GW of wind fully approved – to hit the 82% 2030 renewables target, but actual construction is falling far short.
News from Japan
Chubu Electric Power has withdrawn its restart applications for Hamaoka Units 3 and 4 after an independent committee found staff had for years manipulated seismic safety data submitted to Japan’s nuclear regulator, leaving it unclear if or when the reactors will ever restart.
Podcast of the week
Zugzwang: Episode 3 – What is transmission really worth?
The latest episode of Zugzwang: The market modelling podcast is now available!
Jack Simpson, Oliver Nunn and Jabez Wilson discuss modelling philosophy and put it to work on one of the NEM’s most contested assets: transmission. Listen now on your favourite platform.
The Albanese Government has softened its east coast gas reservation policy, replacing a fixed 20% mandatory reservation on LNG exporters with a cap of up to 20% determined by the Australian Energy Regulator.
Something closer to home: Sydney’s International Convention Centre is being fitted with roughly 4,500 new rooftop solar panels, creating the largest solar farm in any city centre in the Southern Hemisphere and cutting the venue’s carbon emissions by up to 2,000 tonnes a year.
Transgrid’s newly released 2026 Transmission Annual Planning Report shows NSW data centre demand forecasts have quadrupled since last year’s report, with data centres now expected to reach around 3.5GW of peak demand by 2035 and drive 66% of all growth in the state’s end-use electricity consumption over the next decade.
Transgrid has also effectively put up a “house full” sign for new data centres in Sydney, revealing it has received 20GW of connection requests over two years but signed just 1.5GW, and is now steering data centre owners toward regional NSW until major transmission upgrades complete around 2035.
News from Japan
Australia’s ambassador to Japan, Andrew Shearer, used a Japan National Press Club address to call for deeper Australia-Japan energy cooperation, framing the push partly around concerns over China’s growing economic coercion in the region.
Paywalled: Chugoku Electric Power’s Shimane Nuclear Power Station Unit 3 – a 1.37GW reactor that began construction in 2006 but was halted after Fukushima in 2011 – is on track to clear safety inspections and become the first new nuclear unit to come online in Japan, with operation expected by FY2030.
Paywalled: Kawasaki Heavy Industries and Germany’s RWE are installing a 30 MW-class hydrogen mono-firing gas turbine in northern Germany, capable of running on 100% hydrogen or co-firing with LNG at various ratios, with the trial run set to begin within FY2026.
Podcast of the week
Catalyst with Shayle Kann asks whether data centers actually increase electricity prices; the answer is more nuanced than it first appears, with data centres able to lower local utility rates even as they contribute to rising grid costs elsewhere.
What data centres do to the NEM, & the regulatory path to manage it
Data centres are no longer a hypothetical addition to the National Electricity Market. AEMO’s 2026 Electricity Statement of Opportunities, published in August, counted 225 known data centre projects at various stages of the connection process, with proposed connection capacity across all stages having risen from 38 GW to 67 GW over the past year. This article models the consequences of that arrival for the power system, then closes with our regulatory review – our position on the AEMC and AEMO proposals now on the table to manage it, and a practical action plan for data centres.
This piece models a range of build scenarios of data centres, first with all mainland states available and a second set of modelling sensitivities that removes Queensland from the candidate set entirely, which for the time being, has far fewer data centres projects going ahead. Second, in the regulatory review that closes the piece, we set out our position on the four recommendations in the AEMC’s July 2026 advice to the Energy and Climate Change Ministerial Council on data centre regulatory pathways, and on AEMO’s July 2026 rule change request on the operational integration and visibility of large inverter-based loads.
We take our house view of the NEM – the Headwinds scenario – and treat data centre load as flat and inflexible: a hyperscale campus runs at a load factor near 90%, with little seasonal signature and near indifference to time of day. We state that assumption up front because it matters – if data centres can flex meaningfully, for example by drawing on backup generation as demand response, these results are an upper bound on the disruption caused. We do not model that flexibility here. Instead, it is reserved for bespoke modelling. Critically, a flat load profile is a poor match for the system we are building. A NEM increasingly dominated by solar has energy to spare in the middle of the day and very little to spare overnight. A load that draws the same power at 2am as at 2pm is, in effect, a request for firm overnight energy.
Checking the scale of our modelling against AEMO’s own numbers takes some care, because the two are not built on the same base. Our Headwinds case already carries its own data centre and large-load growth, rescaled from the 2025 ESOO. This is about 23 TWh nationally by 2035‑36 before we add anything. Our 500–5,000 MW scenarios sit on top of that. AEMO’s 2026 ESOO, published a year later, forecasts total data centre consumption reaching around 34 TWh (13% of NEM operational consumption) by 2035‑36 under its central case, which is an upward revision from the assumptions embedded in our base case equivalent to roughly 1,400 MW of our own incremental scenarios, in just twelve months. Add our full top scenario to the Headwinds base and total data centre consumption reaches around 62 TWh by 2035‑36 – roughly 80% higher than AEMO’s newest central forecast. Put another way, most of our scenario range now tests a more aggressive data centre future than AEMO itself expects in the 2026 ESOO, and even at the top of that range we are not modelling a reliability crisis.
Where the load goes, and what it costs
We ran two sets of sensitivities over the Headwinds scenario: one with every mainland subregion available to the model, and one with Queensland removed from the candidate set. Both start from the same solved zero-load case, and in every chart below Queensland-available sits on the left and Queensland-excluded on the right. Placement is decided on least system cost at the sub-regional level. Within each set of sensitivities, load is added a tranche at a time, where a tranche is an additional 500 MW of data centre load landing on 1 July 2028. Once a tranche is placed it stays placed, so each successive run tells us where the next 500 MW would go given everything that came before it. Throughout, the model is free to re-optimise the generation and storage build in response to the new load.
Concentration is structural, not Queensland-specific
With Queensland available we test ten discrete data centre scenarios, in 500 MW increments from 500 MW up to 5,000 MW. Excluding Queensland, we run a coarser sweep of five to the same 5,000 MW. Each is a separate case rather than a phase-in. The 5,000 MW scenario means 5 GW of data centre load already online on 1 July 2028, not a gradual path to that point. What accumulates across the runs is the siting, not the timing – the tenth run places its 500 MW knowing where the previous 4,500 MW went. This matters for reading every chart that follows, because the x-axis is a menu of alternative futures, not a timeline.
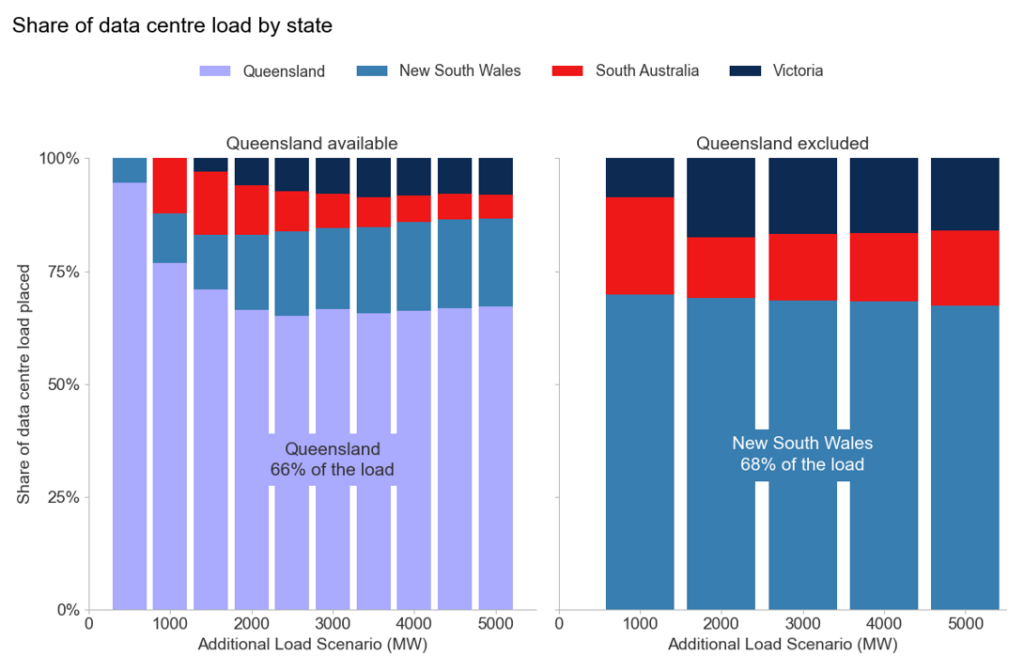
Queensland takes 66% of the load when it is available. Remove it and New South Wales takes a near-identical 68%. A policy that steers load out of one region relocates the concentration rather than dissolving it. The sharper element of this is not on the chart, because it is a zero value. No load is placed in the Sydney basin in either sweep – New South Wales’ share goes to the state’s far south and far north, away from the population centres. The efficient answer never points at the actual load centre. The case for planning efficient locations does not depend on Queensland being the answer, but rather on concentration being predictable and pointed somewhere different from where developers are actually building.
Every gigawatt of load pulls in about five gigawatt of new plant
This is the chart that matters most. In the long run, every gigawatt of data centre load requires 4.93 gigawatt of new wind, solar, storage and gas peaking. That ratio holds regardless of where the load is sited. Both sweeps converge on the same 4.93 requirement by around 2043, and stay there. The composition is also consistent. Solar and wind carry the bulk of it from the earliest years, with OCGT and batteries layered on top to firm the last stretch. That ratio is what a flat load costs in a weather-dependent system. One gigawatt drawing continuously needs about 8.8 TWh a year, and wind and solar deliver at capacity factors of a quarter to a third. The remaining quarter of the build is batteries and gas peaking, which are there to carry that energy into the hours the load still draws and the weather does not deliver.
What differs is not the destination but rather the journey to get there. With Queensland available, lighter scenarios sit well below the 4.93 line through the mid-2030s. The system is drawing on spare capacity rather than building toward the requirement. Exclude Queensland and the climb is steeper and earlier, with less of the volatility that comes from leaning on existing plant. The next chart shows that difference in timing.
The build does not shrink but instead is brought forward
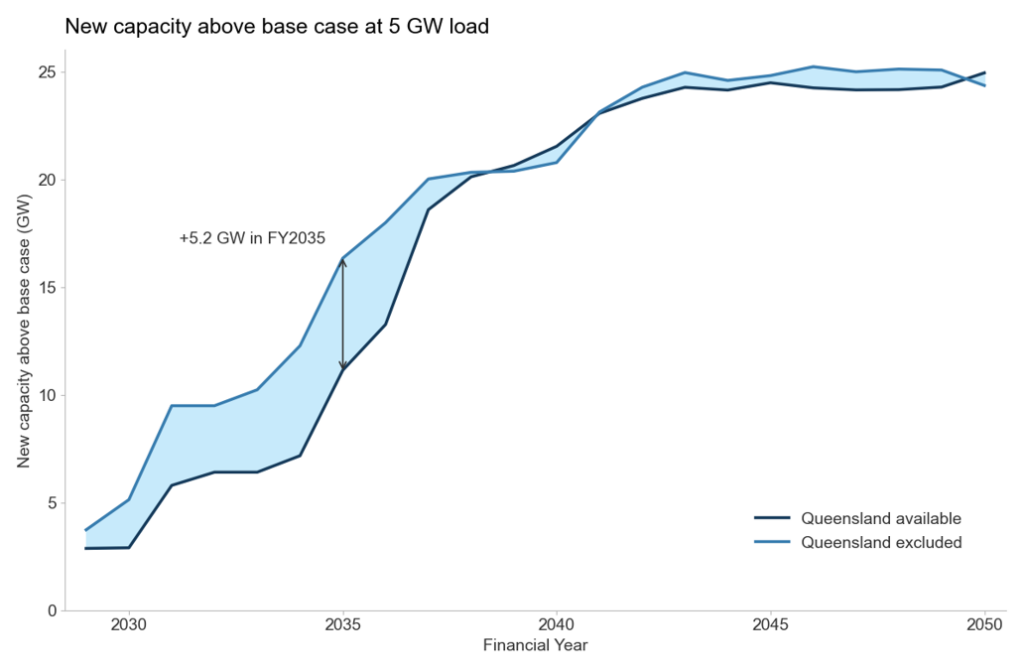
Both sweeps finish within about a gigawatt of each other. In particular, 23.1 GW of new capacity above the base case at FY2041, converging to 24.9 GW against 24.4 GW by FY2050. The end-state build does not depend on where the load sits. This is the same 4.93 ratio from the chart above, expressed in absolute gigawatts instead of a per-GW rate.
The timing is what shifts between the scenarios. The Excluding Queensland scenario needs 12.3 GW of new capacity by FY2034 against 7.2 GW when Queensland is available (ie, 71% more) with the gap peaking at 5.2 GW in FY2035 and closing only from FY2038. This is the breathing-room effect – ie, Queensland’s existing coal fleet is spare, dispatchable capacity the system can lean on immediately. It follows that siting load against it defers the new-build requirement rather than avoiding it. A flat, 24/7 load is exactly what increases a coal plant’s capacity factor. Move the load to New South Wales, Victoria and South Australia and it cannot reach that coal in Queensland. Instead the system must build its way to the objective, instead of dispatching its way there.
Prices redistribute rather than rise
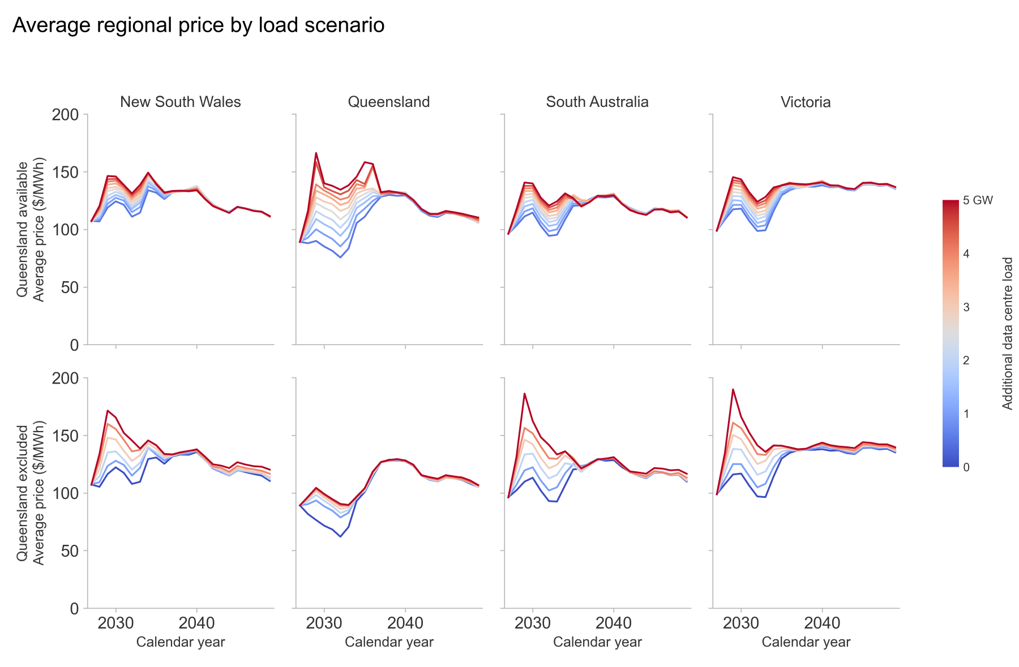
Average annual spot prices fan out sharply as the load arrives in 2029, then close again by the end of the 2030s. With Queensland available the effect is overwhelmingly a Queensland one, with prices there reaching $166/MWh in 2029 against a base case of $77/MWh. Site the same load elsewhere and Queensland’s spike goes, but the spike does not leave the market. Instead, it relocates and splits three ways. In 2029 Victoria reaches $190/MWh, South Australia $186 and New South Wales $172.
Averaged across the horizon the trade is a clean transfer. Queensland pays substantially less (−$19.28/MWh), while New South Wales, Victoria and South Australia each pay between $6.80 and $8.00/MWh more, and the market-wide average is virtually unchanged.
Siting is a distributional question, not an efficiency one. A debate conducted in total system cost will, in the long run at least, conclude that it barely matters where the load goes provided the necessary new generation can be built in time. However, one conducted in regional price outcomes will conclude that it matters enormously.
Eventually the load is served overwhelmingly by new renewables
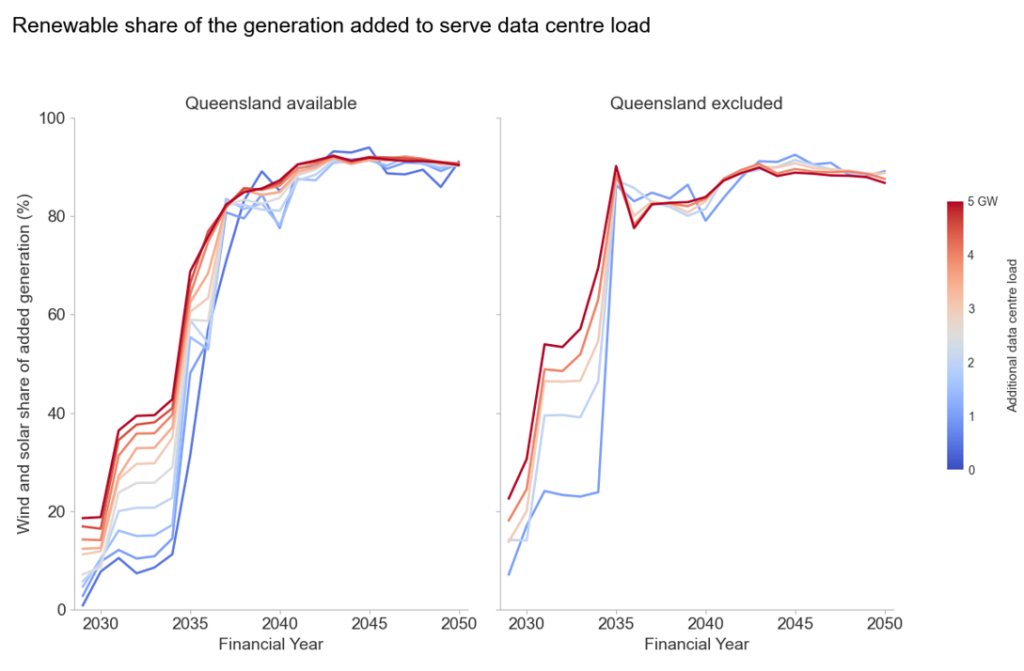
Adding load makes the system build and generate more. This chart asks where that extra generation comes from. For each case we take the generation added to serve the load (the difference from the same run with no data centres) and ask what fraction of it is wind and solar. Through the 2030s that fraction climbs faster the larger the load. In FY2034 it runs from 11% at 500 MW to 43% at 5,000 MW, because a larger commitment pulls renewable build forward. All cases converge above 90% in the early 2040s. Siting also has strong impact on this speed. With Queensland available the share is up to 27 points lower through the mid-2030s, because the load leans on the existing coal and gas fleet instead.
In the near term, load is served by coal and gas, which increase their market share
This is the same arithmetic but interpreted in another way. Coal’s whole of market share falls from about 49% to 15% between FY2029 and FY2040 in every case, which is the scenario’s own coal exit rather than anything related to data centres. The load changes the spacing between the lines. With Queensland available, more load lifts coal’s share by up to 5.4 percentage points in FY2029 and 2.8 by FY2034, because the load sits beside the coal fleet and it runs harder. Exclude Queensland and the lift is half as large, and fades from FY2031 onwards. From FY2035 the order reverses and the heavier cases show a lower coal share because the denominator is growing. In absolute terms coal generation still rises with load in almost every year.
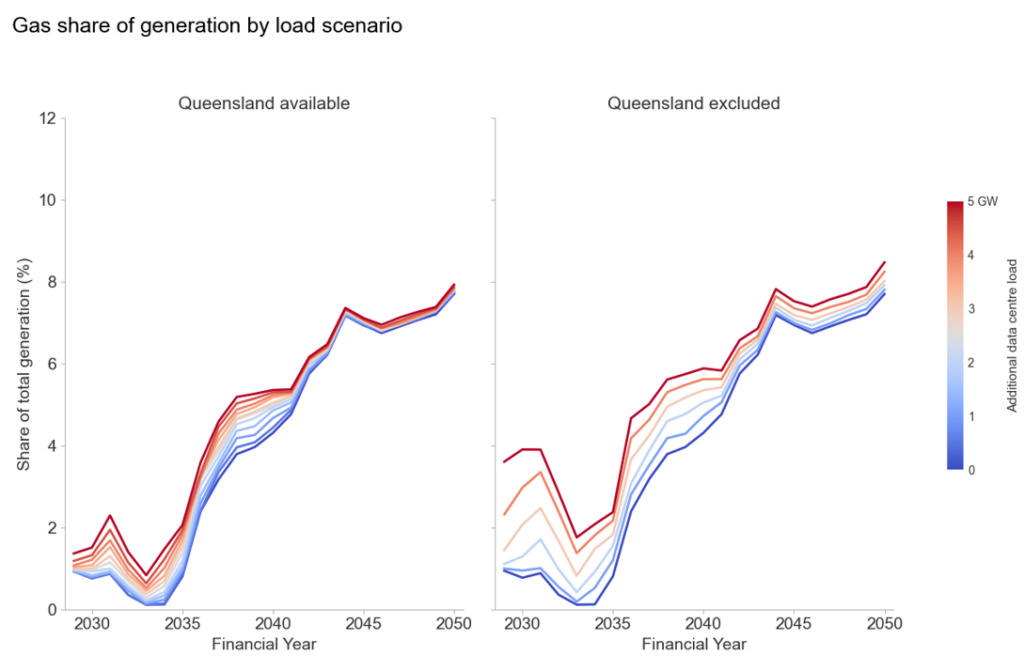
Gas becomes a larger share of total generation as more load is added and the system transitions to renewables
Gas moves in the other direction in every year of both sweeps. More load means a higher gas whole of market share. Without Queensland the effect is roughly double – ie, about 3 percentage points at 5 GW through the early 2030s versus 1 percentage point with Queensland. The share of gas is small throughout, rising from about 1 per cent to 4 per cent as coal leaves, so these are large moves on a small base. Load sited away from the existing thermal fleet gets firmed by gas instead.
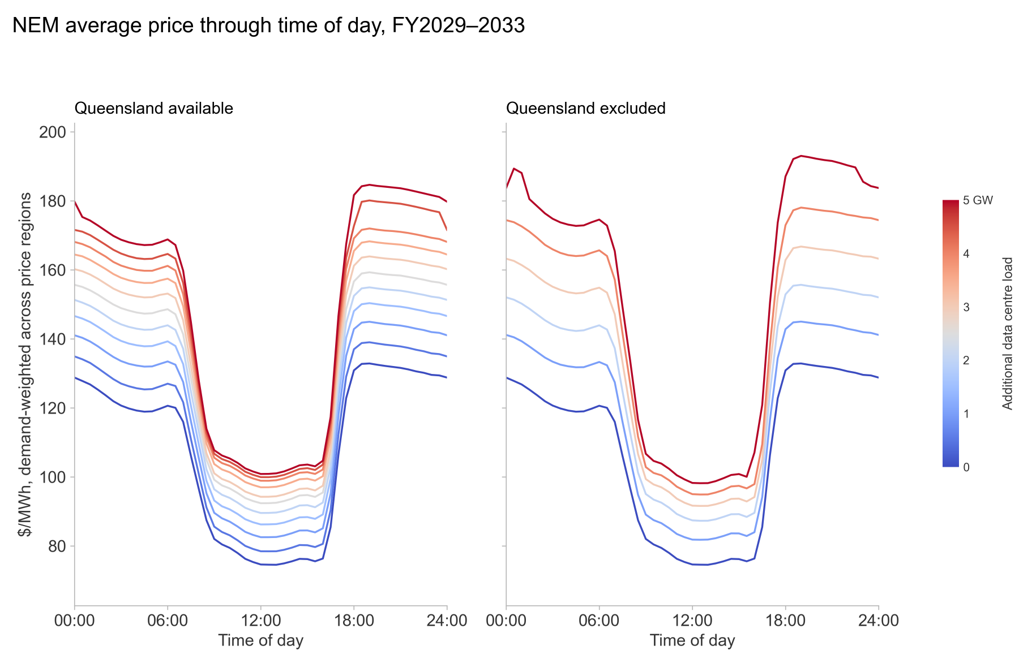
Within the day, the cost lands in the evening peak
This is the demand-weighted NEM price through the day, averaged over FY2029–2033, the first five years of load. A flat 24/7 load lifts the evening peak more than the middle of the day trough. With Queensland available, 5 GW adds $26.50/MWh across the midday solar window but $49.90 to the evening peak. Midday has surplus generation to absorb it, whereas the rest of the day does not. Dispersing the load makes this worse. Excluding Queensland trims the midday uplift to $24.20 and pushes the evening to $57.10, taking the peak-to-trough ratio from 1.68 with no load to 1.73 concentrated and 1.84 dispersed. This is a battery operator’s revenue widening with additional load in the system. The evening-to-midday spread at the 0GW base case is $51.80/MWh which increases to $75.20 with 5GW of additional load if Queensland is available, and to $84.70 if it is not.
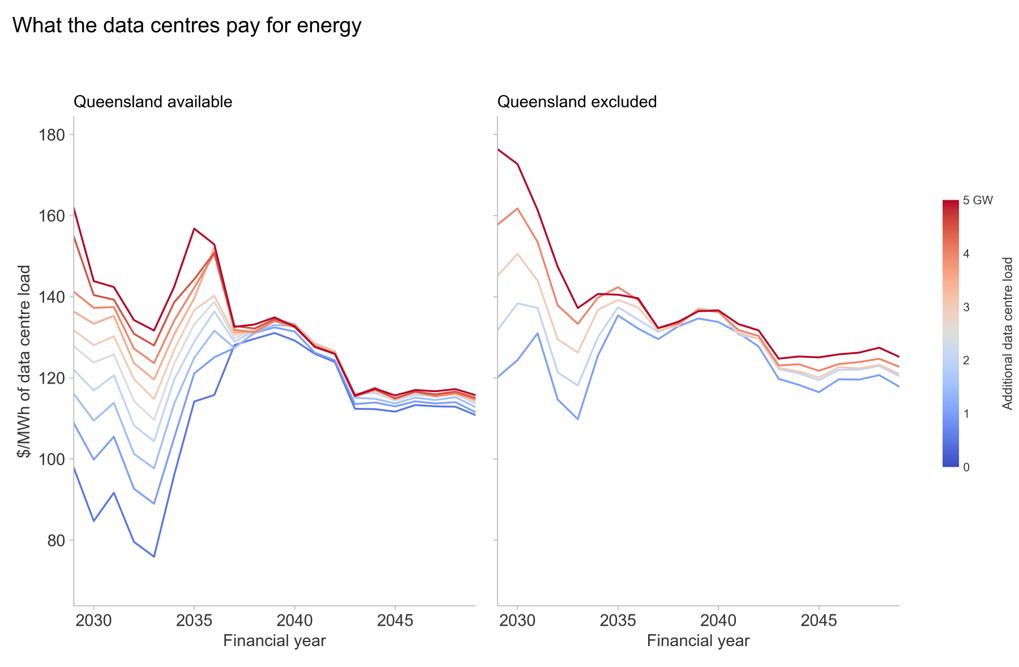
What the data centres pay and when they pay it
This chart shows what the data centres themselves pay for energy. Each case’s bill divided by the energy it draws, priced at the reference node of whichever state each megawatt is sited in, so the whole spread is a siting outcome. The premium for arriving at scale occurs in the short term and then disappears. In FY2029, with Queensland available 5 GW of load pays $161.8/MWh against $97.8/MWh for 500 MW. That gap of $64/MWh closes to $4.50 by FY2037 and averages $3.60 across the 2040s. Greater load does raise the price the load itself pays, so a developer’s cost of energy depends on how much other data centre load turns up alongside it. However, the exposure is to timing rather than to the size of the pipeline. This is because a load arriving after the build has caught up pays close to what a small load pays. Excluding Queensland lifts the whole price fan. A horizon averages $124.5/MWh to $138.1/MWh against $110.0/MWh to $131.8/MWh, and leaves a wider residual spread in the 2040s.
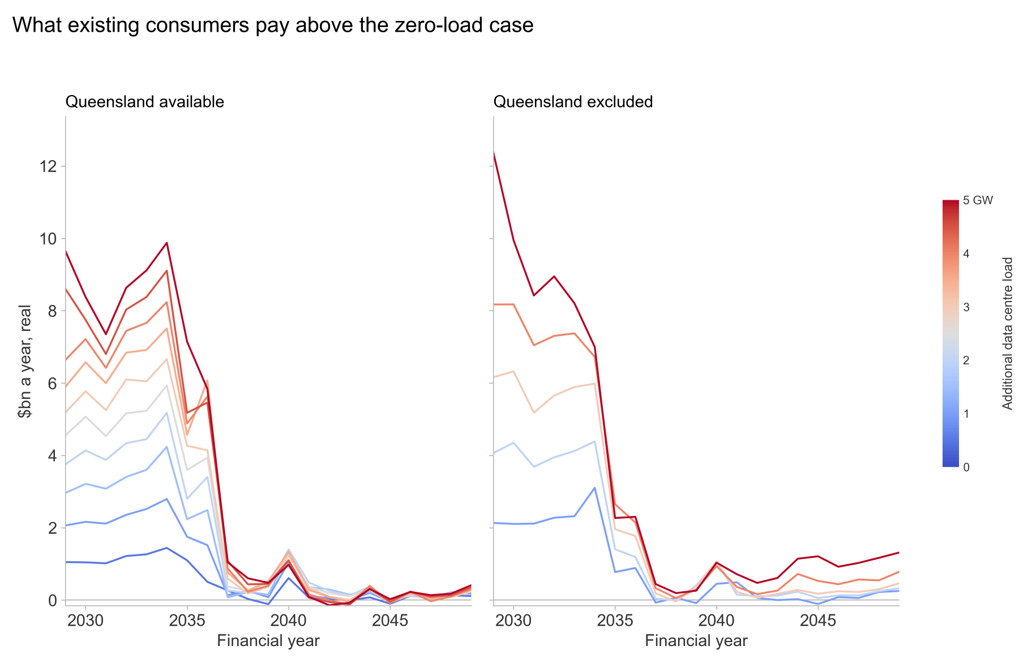
For existing consumers, the first gigawatt is the expensive one
The load pushes up prices and everyone already in the system pays those prices too. This chart helps visualise that bill. We plot each region’s price weighted by the demand that was there before the data centres arrived, less the same figure from the run with no load. That weight (ie, the existing demand in the system) is identical in every case, so what separates the lines is the price and nothing else. There is therefore a significant cost to consumer to bear the additional load in the short term, but it is a transitional cost which largely disappears in the late 2030s.
Wired in: the regulatory pathway
Put these findings together and a consistent picture emerges. New data centre load is met, in sequence, by whatever headroom already exists. Existing VRE and rooftop solar generation first, then spare coal and gas capacity, particularly where load is sited against it. Prices rise through the gap until new VRE, storage and gas peaking arrive to close it, converging on the same 4.93 GW-per-GW requirement regardless of where the load lands. Demand response from data centre backup generation could plausibly shrink that requirement further. We have not modelled that here, consistent with treating the load as flat and reserving demand response for bespoke modelling.
The government appears to be targeting regulation at three objectives:
new supply so prices do not increase;
new renewables and firming, so that emissions do not increase; and
quick connection of data centres, so that we can obtain the benefits of these investments.
It is unlikely that all three objectives can be met, irrespective of any regulation that is imposed. Heavy-handed regulation is unlikely to be able to balance the three. The modelling above suggests the market is already well-positioned to resolve these objectives on its own: a price increase, more dispatch from existing generation, and a dynamic supply response from industry, arriving roughly in that order. That is the frame we bring to the regulatory review below.
In July 2026, the AEMC provided advice to the Energy and Climate Change Ministerial Council setting out four recommendations for a data centre regulatory pathway, namely:
a Renewable Energy Guarantee of Origin (REGO) offset obligation,
a contract/firmness obligation modelled on the Retailer Reliability Obligation,
a market registration requirement, and
streamlined connection agreements for co-located or flexible load.
In the same month, AEMO lodged a separate rule change request (ERC0455) on the operational integration and visibility of large inverter-based loads, which is a broader category that includes data centres, electrolysers and battery charging hubs. The rule change has not yet been formally initiated by the AEMC. We consider each recommendation in turn.
REGO offset obligation should be dropped, not imposed on data centres
The AEMC’s first recommendation would require data centres to surrender a to-be-determined proportion of time-matched REGO certificates from new renewable generation to offset their consumption. We think this recommendation is trying to do two jobs at once – drive new VRE investment, and certify data centre consumption as genuinely renewable – and is likely to satisfy neither, while inheriting every existing weakness of the RET/GOO architecture.
Large Generation Certificates (LGCs) and REGOs are currently in oversupply relative to demand. The Renewable Energy Target has been met, voluntary surrender sits below available surplus, and prices are low. Inserting a new mandatory-demand class restricted to new generation only creates an artificial, policy-driven wedge of demand against a market that is currently oversupplied. This will split the certificate market between new and old project supply, and demand between voluntary and mandatory surrender for data centres. More fundamentally, REGOs and LGCs are fungible, untagged as new-project-versus-existing once issued, and not yet meaningfully time-matched because there is no mature mechanism, such as for a battery to buy a REGO while charging on solar and sell one on discharge in the evening. The costs of this proposal also hinge entirely on a proportion that is, at this stage, undetermined.
Data centres are already voluntarily underwriting new VRE investment. Indeed, cleaner, investable power is part of what draws them to Australia in the first place. It follows that there is no revealed market failure here that requires a mandatory, data-centre-specific obligation. In our view this recommendation more plausibly reflects government’s own concerns about its capacity to procure new renewables than a genuine gap in data centre behaviour. Our preference is to drop the mandatory obligation, or at minimum rely on voluntary surrender, unless and until REGO design is mature to carry genuine temporal granularity.
Our own modelling above reinforces this. The long-run build response to data centre load is overwhelmingly renewable regardless of siting or regulation. Wind and solar already account for the bulk of the 4.93 GW built per GW of load, from the earliest years of the outlook. New, REGO-eligible generation arrives as a by-product of ordinary market response to the load, not something that needs to be forced into existence by an offset obligation.
The contract obligation misreads how data centres procure electricity
The AEMC’s second recommendation would require data centres to demonstrate sufficient firm contract coverage to the AER, drawing on the RRO’s Contracts and Firmness Guidelines, with penalties including early curtailment for non-compliance. This assumes data centres will manage their own firmness position directly – effectively becoming their own market customer.
Any load can choose to do this, but in practice sophisticated end users use retailers. They do so for economies of scale, hedging capability, trading expertise and origination relationships with generators. Expecting data centres to become de facto retail market participants, on top of building and connecting a facility, misreads how the sector organises itself and underestimates the burden involved. Shifting the obligation to the data centre’s retailer instead does not cleanly resolve this either, because it ring-fences the data centre’s load as a discrete parcel when in reality it sits inside a broader retail portfolio that is already subject to financial risk, which is risking duplication with obligations the retailer already carries for its whole book.
We think the better path is to let the market do what it is meant to do. PPAs with developers, retail contracts, and the incremental load itself, when priced into the market, signalling and bringing forward new supply –ie, the ordinary mechanism the NEM relies upon. There is no clear case for a bespoke, data-centre-specific contract-coverage mandate layered on top of it.
This is consistent with what the modelling shows. The incremental capacity the market builds first in response to data centre load is renewable capacity – solar and wind form the base of the build stack from the earliest years, with firming layered on top only as it is needed. Firm capacity is not scarce or slow to arrive, but instead it is what the market already produces without a bespoke contract mandate.
Registration should be light-touch, not duplicate the retailer or the NSP
The AEMC’s third recommendation – ie, mandatory market registration for large data centres – is best read alongside AEMO’s own proposed registration category for large inverter-based loads. We support a genuinely light-touch model, ie, registration scoped to direct operational liaison with AEMO. SCADA and telemetry, modelling, and agreed procedures, with some elements manageable through the NSP’s connection agreement rather than needing separate registration – plus AEMO’s power of direction under NER clause 4.8.9 and the data centre’s reciprocal right to claim compensation. These are hygiene factors for both AEMO and data centres. Getting them resolved cleanly, without scope creep, is what puts data centres in a position to engage constructively on the substance elsewhere.
Market settlement, metering, and demand response participation should continue to run through the parties already registered to serve data centres, ie, retailers, and, for demand response, the Wholesale Demand Response Participants. Data centres should actively resist any move toward full scheduled-unit status, as though they were a generator or a battery, or toward financially responsible Market Customer status, as though they were a retailer. Their demand response can be “unbundled” and be managed by a Wholesale Demand Response Participant.
Connection agreements are the wrong vehicle for bundling in flexibility or reliability commitments
The AEMC’s fourth recommendation proposes faster connection pathways for data centres that co-locate with generation or firming, or that enter flexible demand agreements with networks, backed by jurisdictional data centre infrastructure plans. We think this conflates two different regulatory instruments and is not workable as designed.
Schedule 5.3 access standards set the technical performance of connecting plant. This includes parameters that can be embedded directly in AEMO’s power system models, such as fault ride-through. Negotiated access standards are a mechanism for negotiating that technical performance between the automatic and minimum standard. They are not a vehicle for bundling in demand-flexibility commitments, reliability contributions, or other market and financial obligations in exchange for a faster connection. Judging each connection against a broader commercial criteria is not how the Rules’ connection framework is built to operate and is not a feasible retrofit onto Schedule 5.3 or the negotiated access standards process.
AEMO’s rule change is the one worth engaging on
AEMO’s ERC0455 rule change request is deliberately outcomes-focused and principles-based rather than settled rule text. It covers four broad areas:
streamlined monitoring and communication,
efficient investment signalling through advance notice of demand shifts,
near-real-time demand management, and
improved event management.
It has not yet been formally initiated by the AEMC and appears under-specified. Even so, we think it is the proposal data centres should prioritise, because it can directly address a scenario every other regulatory exposure ultimately traces back to. That is, a data centre drawing power from the grid while AEMO is intervening in the market by shedding consumer load. Data centres should not resist clear, agreed, market-integration, ex-ante direction and disconnection protocols. Refusing them risks the reputationally toxic scenario described above, and resolving them ex-ante is what lets AEMO manage lack of reserve (LOR) conditions without resorting to consumer load shedding in the first place.
Explainer on Lack of Reserve
AEMO is required to keep the system within satisfactory limits and operate the system securely. A power system is vulnerable to instantaneous loss of a single largest generator or transmission element, known as a credible contingency. Being “secure” means the system can withstand a contingency and remain within satisfactory operating limits.
Reserves are the difference between supply and demand. If reserves are forecast too thin, the system is no longer secure. A contingency, should it happen, would push the system outside those limits and risk uncontrolled, cascading failure across the wider grid. Shedding load is how AEMO restores that security margin by deliberately cutting some demand before a contingency occurs, it brings the system back to a state where it can withstand a credible contingency and remain satisfactory.
AEMO tracks this constantly through its reserve forecasting process, and when projected reserves start to run thin it issues a graded set of public warnings called LOR notices. LOR1 signals reserves have dropped below a set threshold and prompts AEMO to encourage generators to offer more supply or large consumers to cut demand. LOR2 means reserves are projected to fall below the single largest contingency in the region, at which point AEMO can direct generators to run or activate emergency reserves such as the Reliability and Emergency Reserve Trader (RERT) to clear the LOR2 from the forecast. LOR3 is the most serious level, when forecast available supply is at or below forecast demand. No reserve buffer is forecast, and load shedding becomes a real possibility to maintain a secure operating state.
This matters for data centres because they are exactly the kind of large, concentrated, always-on load that shows up in AEMO’s reserve calculations. A single hyperscale campus can rival a mid-sized power station in demand, meaning its addition to a region can materially erode the reserve margin AEMO is protecting. Ideally, any backup generation a data centre holds on site should itself be counted in AEMO’s reserve calculations, and the data centre should be able to switch to that backup and disconnect from the grid to clear a forecast LOR2, thus helping avoid the shortfall progressing to LOR3 rather than adding to the problem.
Telemetry provided by the data centre directly or via the NSP should feed AEMO’s energy management system (EMS), real-time contingency analysis and constraint formulation, so the load is priced into security assessments rather than sitting as a blind spot. Critically, it should let AEMO separate a data centre’s steady-state, behavioural load from weather-driven consumer load, producing a clean five-minute dispatch target and pre-dispatch estimate, with dispatch able to adjust to data centre step-changes rather than being blindsided by them. The same SCADA data should measure actual load against its five-minute trajectory for Frequency Performance Payment and Regulation FCAS cost allocation on a proper causer-pays basis – which we would expect to reduce these costs for data centres, not increase them.
A genuine prize is unbundling the demand response of the operation of the backup generation for the data centre load, by participating in the Wholesale Demand Response Mechanism, not RERT. Data centres should be able use a third party participant Wholesale Demand Response Participant to submit bids, get paid for the megawatt, and be counted in AEMO’s reserve calculations. This reduces the frequency of AEMO interventions, directions and load shedding. RERT looks commercially attractive on the surface, with availability and utilisation payments and the ability to place technical limitations on AEMO under contract, but it is inefficient, cumbersome, opaque, and not a long-run solution.
One element is under-baked and worth pushing back on. The proposed ramp-rate limit on large inverter-based loads. Given the volume of battery storage already in the system providing ramping capability, data centres trip to backup only when genuinely required. A bespoke ramp-rate rule solves a problem the system already handles. Load variation over a five-minute window is directly observable via SCADA and can simply be priced through FPP and Regulation FCAS cost allocation, consistent with the causer-pays approach above.
Our two cents
We suggest to data centre owners and investors that they should beware being a facility that draws power from the grid with backup generation idle when consumers are being shed. Or if you are that data centre ensure AEMO is fully aware of why the backup generation cannot operate and it must instruct load shedding instead. The way to foreclose it is operational, not financial, ie, engage constructively on AEMO’s rule change, and offer demand response from backup generation wherever the facility can genuinely carry it.
Accept, and lean into:
Light-touch LIBL registration scoped to operational liaison, telemetry and AEMO’s direction/compensation framework, not full Market Customer or Scheduled Load status.
Full SCADA and telemetry provision feeding AEMO’s EMS, contingency analysis, constraint development and a load-separated operational forecast.
Causer-pays FPP/Regulation FCAS cost allocation based on measured five-minute load trajectories.
Clear, agreed, ex-ante direction and disconnection protocols
Backup generation as WDRM demand response, bidding price, volume and availability, displacing RERT as the long-run mechanism.
Push back on:
Mandatory REGO surrender tied to new-generation supply, which inherits the flaws of an already oversupplied certificate scheme and is better resolved by dropping the obligation or fixing REGO design so certificates carry genuine temporal granularity.
A data-centre-specific contract/firmness obligation modelled on the RRO, which the existing retailer-portfolio RRO exposure and ordinary PPA and retail contracting already handle.
Any proposal to bundle demand-flexibility or reliability commitments into Schedule 5.3 access standards or the negotiated access standard connection process, which misuses an instrument built for technical performance rather than commercial terms.
Ramp-rate limits on large inverter-based loads as currently proposed, which duplicate protection the system already has through battery penetration, fault ride-through standards and SCADA-based cost allocation.
Sequencing:
Treat AEMO’s ERC0455 rule change as the priority engagement. It is the mechanism through which operational trust, visibility and a genuine WDRM pathway for backup generation get built. Resolving it well is what earns data centres the credibility to contest the AEMC’s REGO and contract proposals from a position of good faith rather than obstruction, rather than trading the two agendas off against each other in a single package.
None of this requires treating the arrival of data centres as a crisis for the power system to be managed away by regulation. The modelling above says the opposite. The load will be accommodated, largely by resources the system already has, at a price and on a timeline the market is well placed to work out for itself. Provided new regulation puts the technical and operational connections between data centres and AEMO in place before the load arrives, not after.
Appendix A: Method notes
Scenario and assumptions:
Endgame Headwinds reference case for the NEM;
Load modelled as flat and inflexible, ie, a load factor near 90%, indifferent to time of day and season so these results are an upper bound if data centres flex in practice.
Placement decided on least system cost at the sub-regional level, with the generation and storage build free to re-optimise in response to the new load at every run.
Held fixed and not modelled here:
weather and outage variability (a stochastic treatment would likely worsen 2030s outcomes and shift the storage/gas split);
the transmission plan (generation responds to the load, the network does not);
demand response from data centre backup generation; and
a constrained build, ie, the model builds whatever the load requires, without testing whether the connection queue and supply chain could actually deliver it on this timeline.
A fire has completely destroyed Tungatinah Power Station in Tasmania’s Central Highlands; Hydro Tasmania and TasNetworks remain confident the wider grid remains secure with the gas-fired Tamar Valley Power Station coming online to cover the shortfall.
WA’s Economic Regulation Authority has fined state-owned Synergy $1.2 million after a trading software error let it inflate wholesale prices from its Kwinana battery, extracting an extra $850,000 and lifting overall wholesale costs by roughly $9.5 million over an eight-month period.
AEMO and SA Power Networks ran their annual rooftop-solar “fire drill for the grid,” remotely curtailing tens of thousands of South Australian solar systems for up to an hour to test the emergency backstop system.
The AER has released a preliminary position rejecting Transgrid’s bid to pass an extra $1.2 billion of Project EnergyConnect cost blowouts onto consumers.
Victoria has launched Australia’s first offshore wind auction, seeking 2GW of capacity in the Gippsland zone with bids closing in August 2027, as the state races to replace coal capacity ahead of Yallourn’s 2028 and Eraring’s 2029 closures.
News from Japan
Japan’s industry ministry has asked Hitachiomiya City, near Tokyo, to accept a two-year literature survey on hosting the country’s final high-level nuclear waste repository, only the second time the central government has proactively requested a site rather than waiting for a local volunteer.
Podcast of the week
The latest episode of Zugzwang: The market modelling podcast is now available! In this episode Jack Simpson, Oliver Nunn and Endgame consultant, Harry McArthur break down our latest modelling on where data centres should be located – and what it means for prices, gas, and the coal fleet along the way. Listen now on your favourite platform.
AEMO’s 2026 Electricity Statement of Opportunities shows an improved reliability outlook with gaps not emerging until 2030-31 in NSW and Victoria under the official standard; WattClarity questions whether that improvement is partly an artefact of a contested 2023 methodology change adding 6-12 month buffers before new projects count toward the forecast.
Chris Bowen has launched Capacity Investment Scheme Tender 11, seeking 1.8GW of wind and solar in WA to help replace coal plants closing by 2029. In spite of this, recent analysis from the ABC shows that only 4 of 31 Capacity Investment Scheme-backed wind projects reaching financial close as construction costs have risen 30-50% since bids were submitted.
The AER has released its Strategic Plan 2026-2030 with concrete commitments including implementing an effective domestic gas reservation scheme and driving more efficient utilisation of electricity distribution networks.
Victoria has opened its first offshore wind auction, seeking 2GW of capacity across Gippsland and Warrnambool zones (enough for 1.5 million homes), with bids closing August 2027, contracts awarded in 2028, and first power expected in 2035.
The Australian Renewable Energy Hub has shrunk from a planned 26GW to 15GW, with proponents InterContinental Energy and CWP Global dropping the hydrogen and ammonia export components entirely.
Oxford Economics forecasts Australian data centre electricity demand will more than triple from 5.1TWh in FY26 to 33.7TWh by FY36 under its central scenario, with NSW and Victoria accounting for over 85% of that load and data centres consuming up to 19% of those states’ grid-supplied electricity by then.
News from Japan
Paywalled: Kirin has begun producing green hydrogen on-site at one of its beer factories using a 280kW solar array, targeting 70-80 tonnes of hydrogen annually to cover up to 23% of the plant’s heating needs.
Paywalled: Japan’s grid operator OCCTO has proposed a new “Complementary Auction” within its Capacity Market, run alongside the existing Reserve Power auction, both effectively paying older thermal plants to stay online amid concerns that supply will remain tight through FY2030.
Podcast of the week
Catalyst with Shayle Kann talks to Voya Energy’s Richard Wang about replacing diesel backup generators with an electrochemical generator that produces electricity from aluminium pellets and air.