The electricity market will change how we drive. Is policy keeping up?
Endgame Analytics is launching a new research series on decarbonising transport. We are pleased to partner with SCT Consulting to explore the emerging electric vehicle market and its growing nexus with the electricity sector.
The shift to Battery Electric Vehicles creates a bi-directional relationship where charging behaviour affects grid stability, and electricity market volatility dictates transport costs.
Some key highlights:
Cost of Driving: BEV drivers will see fuel cost savings of between 65% to 100% compared to ICE vehicles, depending on when they charge — and with Vehicle-to-Grid technology, drivers could even be paid to charge.
Induced Demand: These lower operating costs have significant implications for future travel demand and congestion.
The Shadow Price of Mobility: Vehicle to grid technology introduces a new opportunity cost. Will drivers choose to forego a trip to capture the revenue from discharging to the grid?
Read the full paper here to understand the impacts on appraisal, policy, and the future research needed to support the transition.
Economic Regulation Authority Western Australia release Benchmark Reserve Capacity Prices for the 2028/29 capacity year, using six hour BESS as the Benchmark Technology.
Spot prices are the mechanism by which the energy market signals the needs of the power system to participants, investors, and consumers. So when we see something strange occurring in the behaviour of spot prices, it warrants attention. In this article we examine how spot prices are becoming more ‘noisy’ (ie, they are oscillating more frequently). We present analysis of spot price noise, some preliminary theories about what is causing it, and what the consequences may be.
What do we mean by noise?
First, we must define the concept of spot price noise. From a mathematical perspective, noise is the transient oscillation of a time series that is typically overlaid on top of some underlying trend. Note however that ‘noise’ is typically random, although it is not entirely without structure.
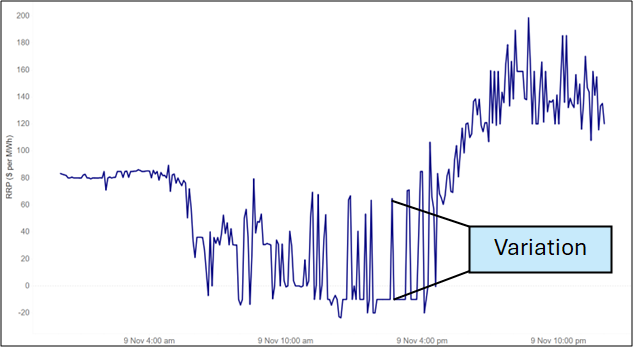
For our purposes, we use the mathematical concept of ‘variation’ as our proxy for noise – ie, the difference between any two consecutive intervals between the spot prices. For example, when spot prices for 4 intervals are $50, $100, $75, $20 then the variation outcomes are $50, -$25, -$55. Figure 1 illustrates the concept of variation on a recent day for NSW.
Figure 1 – Illustration of variation; NSW 9 November 2025
Given that we are not interested in scarcity events where prices signal underlying shortage of generation, we have capped all prices at $300 per MWh before calculating variation. We do not see these outcomes as noise, but rather an important signal in prices to reflect scarcity. In addition, when summing variation over time we will also use the concept of the absolute value of variation to capture both positive and negative movements, which might otherwise cancel each other out.
Variation has been rising
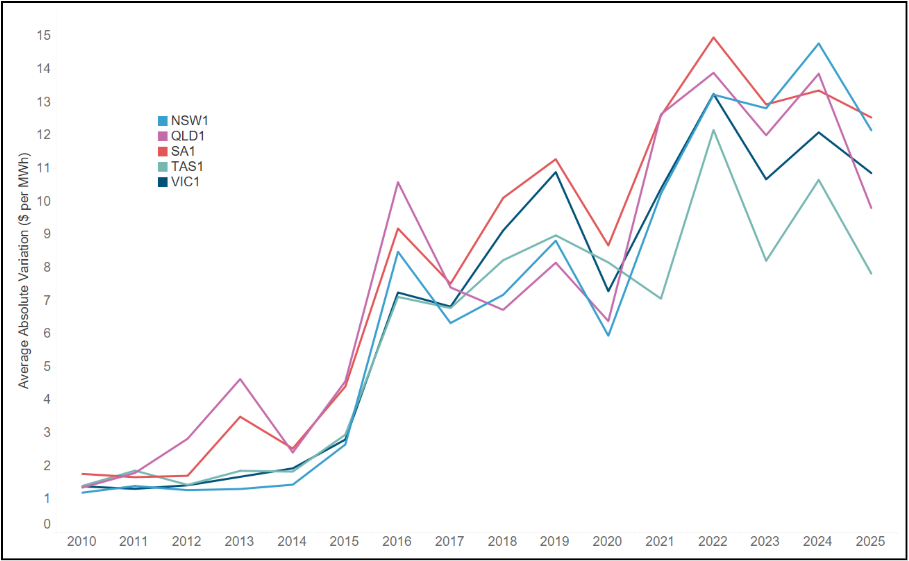
What has been happening to variation over the history of the NEM? Figure 2 shows the average absolute variation from 2010 to 2025 for each region of the NEM. The rise in variation is enormous. In 2010, the average difference between 2 dispatch intervals was around $1 per MWh across all regions; in 2025 that number exceeded $10 per MWh.
Figure 2 – Average absolute variation by NEM region, 2010 to 2025
What else do we know about variation?
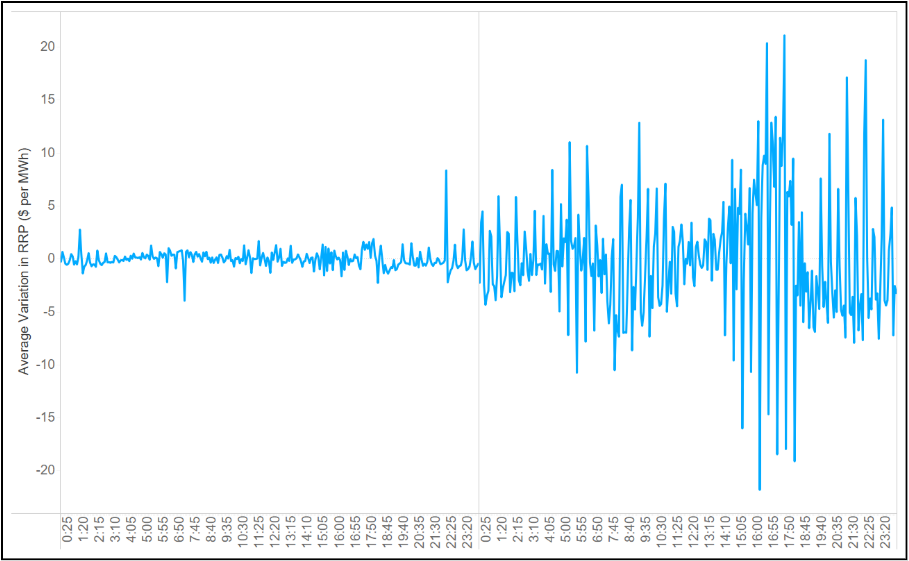
Figure 3 shows average variation by time of day for NSW in 2010 and 2025. Two observations:
Variation has increased across the day, but it is greater at some times than others. This would be expected due to the presence of the duck curve, but there are also increases in variation during the middle of the day and overnight.
There appears to be a periodicity to the average variation in 2025 – it exhibits spikes that seem to occur with a regular frequency.
Figure 3 – Average variation in NSW by time of day, 2010 versus 2025
It is this second feature that is of most interest. Why should there be any intraday structure to the average noise if it is indeed just caused by random perturbations in the supply and demand curves? Is there something causing the noise that means it is in fact partially deterministic rather than purely stochastic?
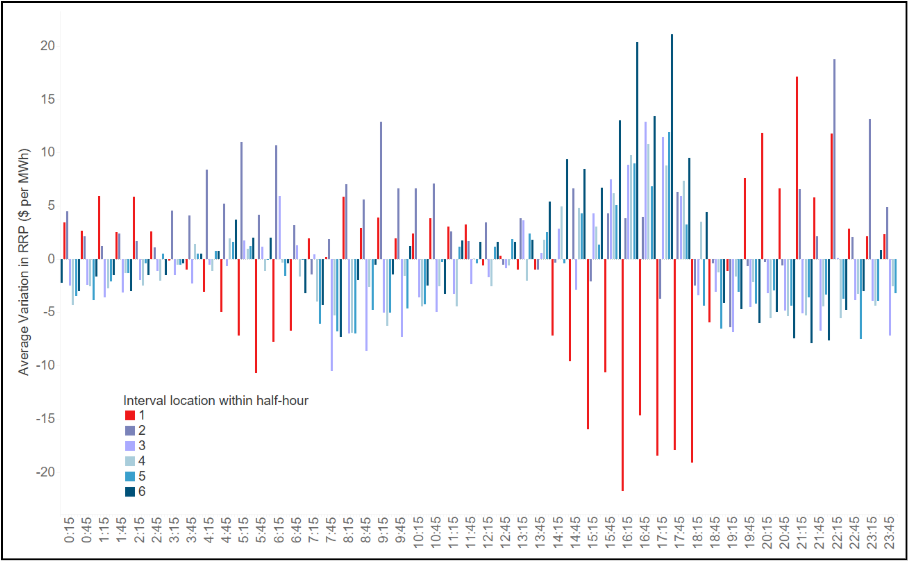
Figure 4 shows the average variation by time of day for NSW. To aid in the visualisation we have added colours to each observation based on where the dispatch interval occurs during the half-hour (ie, a number between 1 and 6).
Figure 4 – Average variation in NSW by time of day, Calendar Year 2025
The results are striking:
The positive spikes in variation tend to occur in the last 5 minutes of the half hour (shown in dark blue).
The negative spikes in variation tend to occur in the first 5 minutes of the half-hour (shown in red).
There is a clear structure to the variation depending on the location within the half-hour.
This seems to suggest that the ‘noise’ we are seeing is, at least in part, being driven by something structural that depends on the temporal location within the half-hour.
Why is variation so structured?
With 5-minute settlement having been in effect for some time, the temporal structure of variation is surprising – why does it matter whether it is the first or last interval of the half-hour? There are only two possible overarching causes: demand or supply. We start with a look at supply.
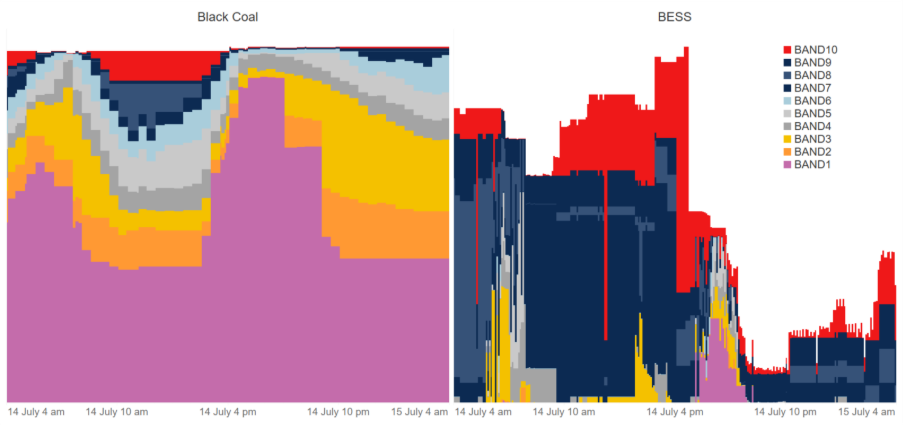
A simple analysis of bids in NSW reveals at least one possible reason for the structure. Figure 5 shows a recent sample of the aggregate final bid stacks for NSW Black coal on the left and NSW BESS on the right. Interestingly, the bid stack of NSW Black Coal is defined on a half-hourly basis, whereas BESS varies by 5-minute interval.
Figure 5 – Sample of bids for NSW black coal and NSW BESS
This would suggest that the supply curve is flat within the half-hour. We have analysed the bids for all thermal generators in the NEM, and a large proportion of them still supply bids on a half-hourly basis. Interestingly, Snowy’s bids are defined on a 5-minute interval basis.
Much more analysis would be required to pin down the exact relationship between noise and the supply-demand balance. But at this stage, we posit that an increased variability in both demand and VRE have led to increased variability in the exact point at which supply clears against demand. At the same time, bid structures have remained relatively lumpy and have not (with the exception of batteries and some hydro) adapted to the changing conditions. The root cause of the change in noise warrants deeper analysis, but the 30-minute structure of bids seems a good starting point.
What are the consequences of the increase, and possible vanishing, of noise?
Noise is a big part of the battery business case. Noise lifts the highest daily prices and drops the lowest daily prices. This increases the opportunity for arbitrage by batteries. Indeed, the challenge of obtaining a high ‘percentage-of-perfect’ outcome is driven by the increased presence of noise, which makes it harder to time charging and discharging to achieve an optimal outcome.
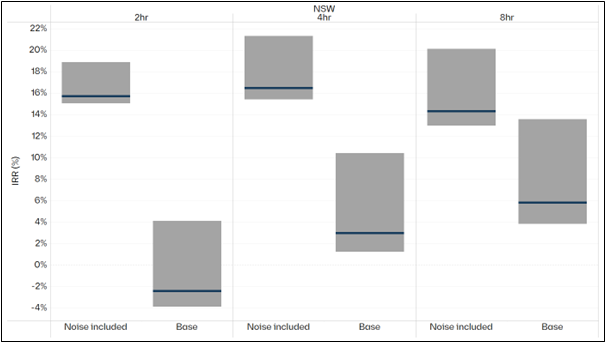
Figure 6 shows the range of returns to batteries in NSW of different durations with and without historical levels of noise being included in the modelling.
Figure 6 – IRR for indicative battery of different durations in NSW, noise versus base
The shorter the duration of the battery, the more dependent it is on noise. This makes sense because as duration increases, the spread of each full cycle must capture higher buy points and lower sell points.
Were noise to increase, the relative business case for shorter duration batteries would improve. Alternatively, were noise to decrease, the business case for shorter duration batteries would be more adversely affected than for longer durations.
It follows that investors and market participants need to have a better understanding of how the inclusion of noise affects their projects, and to stress-test their models to include different levels of noise.
Finally, we note that it is unclear whether noise is a feature or bug of the NEM. In particular, is it:
a sophisticated signal provided by the energy only market, that we do not yet understand; or
a pathological outcome of bidding behaviour that is making it harder to invest and make sensible decisions.
More to come from us on this in the coming months.
Late last year we published a piece examining the importance of weather and stochastic variables to price outcomes. Since then, we have repeatedly been asked to explain how these stochastic variables behave, their influence on price outcomes, and the broader implications for the grid. We have been uplifting our own capabilities in modelling these stochastic factors. Most notably, we are increasingly conscious of the implications of there being a wide range of possible outcomes for reliability. Against this backdrop, in this article, we examine how outcomes differ when we alter weather and demand-supply (i.e., assumptions about adding or losing a major unit). We show that an analysis of median or average outcomes based on a single weather reference year, and a single set of demand assumptions is wholly inadequate for understanding variability, uncertainty and risk, and most importantly the reliability of the system. We want to stress test the system that is implied by a median set of conditions and see how it performs.
Moving from averages to distributions
The computational complexity of running market models means that it is costly in terms of time and computational resources to run many different simulations of the future. Average or ‘typical’ conditions are used as the basis for most long-term capacity expansion forecasts for this reason. Yet this is no longer enough. We cannot shoehorn a stochastic system into a deterministic model – we are misleading ourselves if we think that this will be adequate to guide us through the maze of complexity that awaits us in a high penetration renewable future.
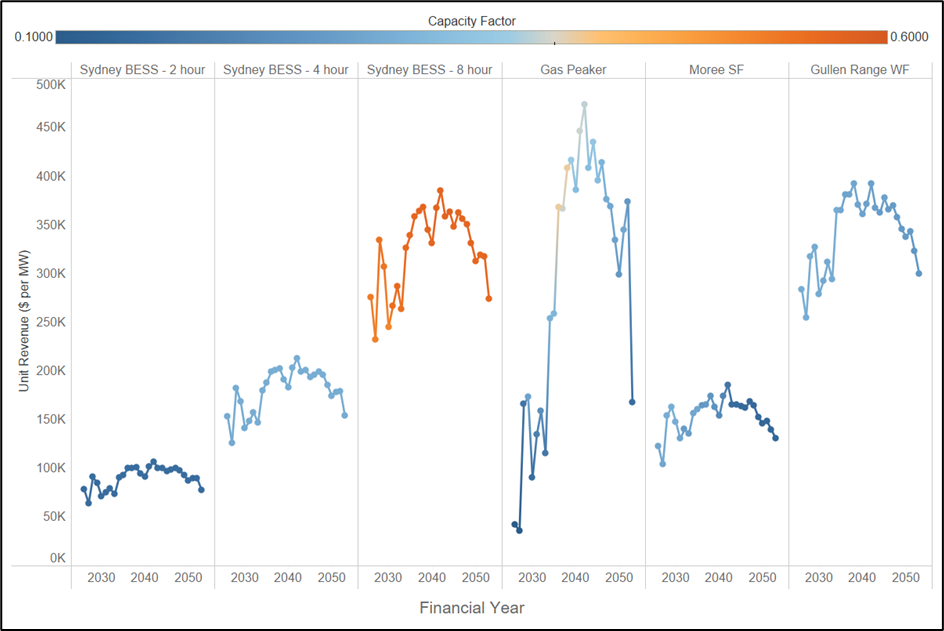
Figure 1 shows the average revenue per megawatt for a range of assets in NSW under a median weather reference year, and a single realisation of demand. For the purposes of this article, we have used Endgame’s Sunny-side up scenario as the basis for our forecasts. This scenario assumes a new build profile that is based on a median weather reference year, with a high (POE10) assumption about demand. The colour scale shows the capacity factor of each of the assets. We note the following:
Longer duration batteries make more money per MW of installed capacity.
Gas proves its value later in the horizon, as renewable penetration increases.
Wind makes solid returns because our modelling assumes constraints on the new build of this technology, limiting new entry from competing away profits.
Figure 1 – Revenue per MW for a single weather year for assets in NSW
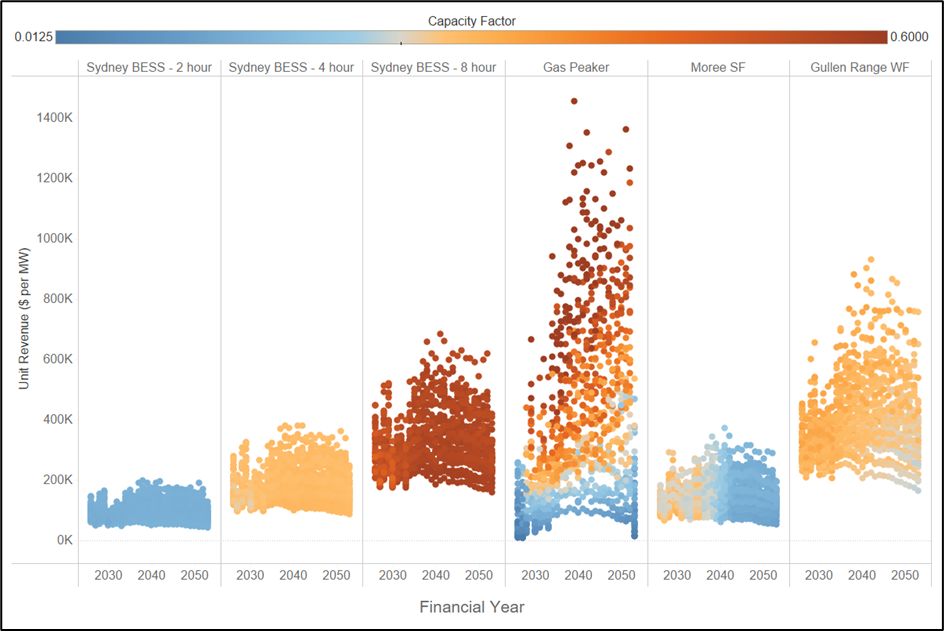
But how does this picture change when we consider many different reference years and allow for ups and downs in supply (eg, N-1 or N+1 relative to forecast). The result is shown in Figure 2. Each dot represents a single realisation of revenue per megawatt for a single year.
Figure 2 – Distribution of revenue per MW for 3 demand sensitivities, 13 weather years
We observe the following:
The upside for longer duration batteries is far greater than for shorter duration batteries.
The range of outcomes for wind is far greater than for solar.
The most striking outcome is that gas generation can earn super-normal profits in some years, and in other years it can fail to earn anything.
What does this mean for the gas supply system?
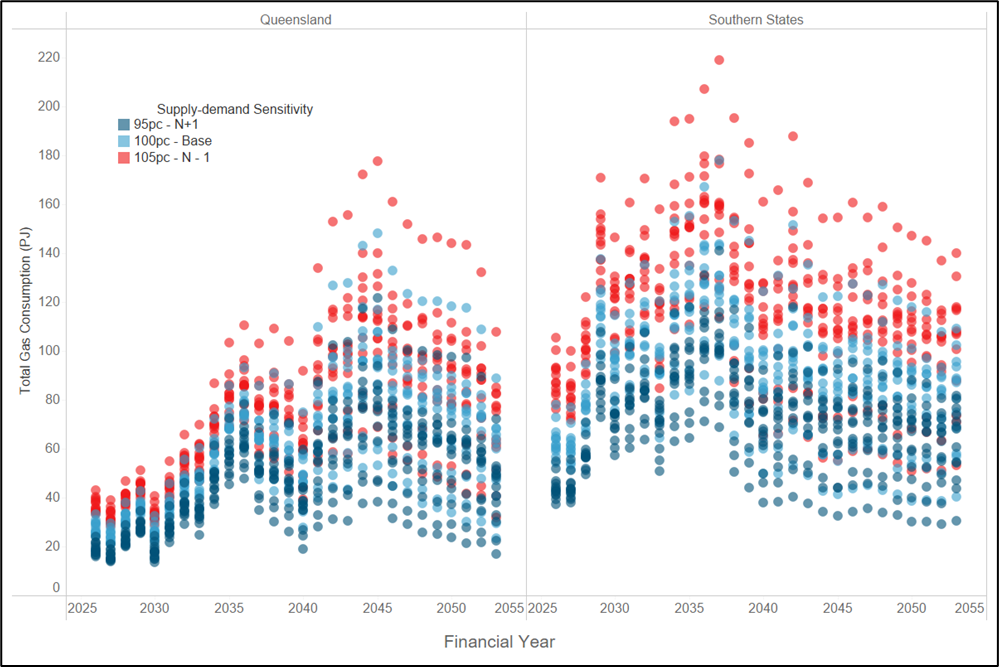
The differences between the outcomes in Figure 1 and Figure 2 completely changes how we should think about each of these assets, and the system as a whole. For example, consider the implications for gas consumption via gas-powered generation (GPG). Figure 3 shows the differences in total GPG consumption across each weather year and demand sensitivity. We can see differences in a given year of up to 120 PJ across the southern states.
Figure 3 – Distribution of GPG for 3 electricity demand sensitivities, 13 weather years
This gives rise to many questions, such as the following:
What does this mean for planning purposes?
What is the value of ‘insurance-style’ assets that can deliver gas in outlier years?
How resilient is our current system to these types of events?
How do we reward gas production and transportation and long duration pumped hydro facilities that may only be required with a low probability?
What does this mean for gas turbines that are contracting for gas supply?
Indeed, the consequences are too many to enumerate here. But the key point is that unless we understand the distribution of outcomes, we have no chance of planning for the future that awaits us.
Stress testing to understand reliability
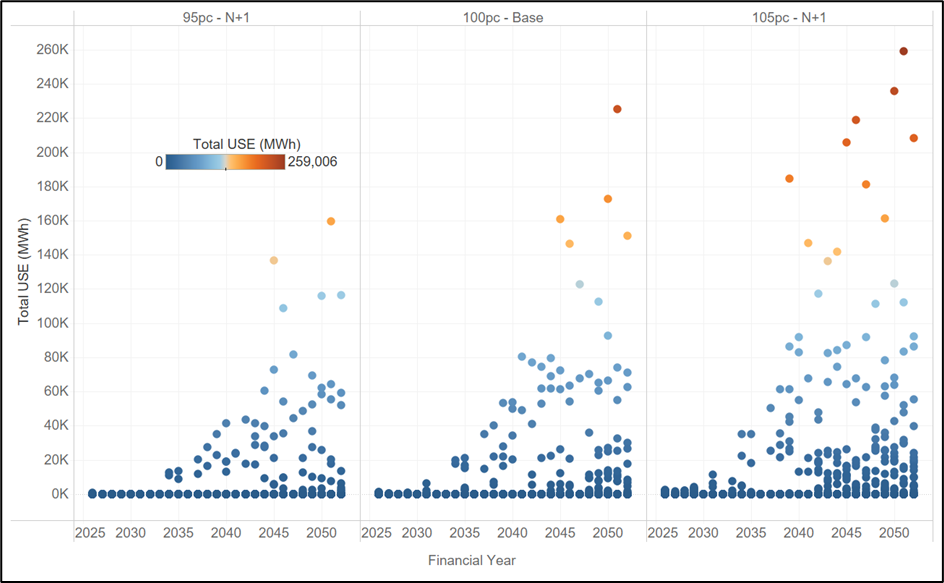
We have examined the consequences for gas, but what does this mean for system reliability? Our analysis shows that the variability of output for renewables has consequences for the reliance on gas. But what about unserved energy (USE) – ie, how often will weather and demand variability lead us to run short of generation, and how far are we at any point in time from shedding load?
Figure 4 below shows the consequences for unserved energy across 13 weather reference years and 3 demand-supply sensitivities. The result is that as renewable penetration increases over time, although the median conditions exhibit no USE, the distribution has long tails.
As the system becomes more stochastic, the importance of considering these extreme events only grows. By the 2040s we are in a situation where a shock to the system leads to outcomes that would not be considered reasonable by consumers (eg, 50-100 times the reliability standard in NSW). We note that these are driven by plausible and quantifiable variations in supply and demand, rather than ‘black swan’ events that may be examined by others in the sector.
Figure 4 – Projected USE in NSW for Sunny-side up scenario implied by distribution across 13 weather reference years and 3 demand-supply sensitivities.
This is not intended to be taken a criticism of renewables, but rather an observation that current modelling of single realisations of the future is inadequate to inform the needs of the system. We need a different approach. We make the following recommendations:
We need to start stress testing the system of the future, and understanding how variability in weather, demand, and gas supply influence reliability and resilience. In our opinion, the current ESOO is a solid starting point, but does not address the question of how we should go about filling the gaps that it identifies.
We need to think about how the assets that will provide resilience to these events will be rewarded in the market. Even with a very high market price cap, a generator that is only required under very extreme circumstances may never get built because of the challenges of obtaining financing for assets that are only used in 1 in 50 or 1 in 100 year events.
Finally, stress testing needs to consider all elements of the energy supply chain. From gas supply to hydrology and network availability. Models that can provide insights into these risks will help us build a system that exploits the many advantages of renewables, but recognises and addresses the blind spots of a high VRE system.
In conclusion, we need to understand that the nature of risk in this future system is fundamentally different to that which existed in our legacy system, and that our existing approaches may give highly misleading answers as to reliability and risk.