


What cancelling VNI-West means for the energy market and the future power system
VNI-West sits in the forward plan for the NEM, but its future is now uncertain. It has been the subject of a long and difficult public debate about cost, route and land use, and there is a live possibility that the project does not proceed. Most of the analysis published on the project to date has been directed at the explicit cost of the project. Comparatively little has been directed at what the world looks like with and without the project, and in particular the key question: what does the power system look like without VNI-West and what must happen in its place?
Against this backdrop, in this article we consider a range of projections to improve our understanding about the consequences of the project not proceeding. We do not seek to express views on the non-quantitative merits of the project, on whether its costs are reasonable, on the land use and social licence questions along the route. Those are matters to which a model has nothing useful to contribute. What a model can do is trace the consequences for the power system, the electricity market, and the broader energy system.
We take our reference case for the NEM, remove VNI-West, and consider what happens when we do nothing, or when we allow the model to re-optimise the generation and storage build in response. We consider three questions:
- What happens to prices, in Victoria and elsewhere?
- What does the system build instead?
- What does that build do to gas consumption?
The short answer is that the price effect is large and it persists, the system does not really replace the interconnector so much as run a more expensive version of itself without it, and the difference is accounted for by increased consumption of gas for power generation.
Where the project stands
VNI-West entered the 2022 ISP as a staged actionable project. AEMO Victoria Planning and Transgrid published the PACR in May 2023, identifying a 500 kV double-circuit line from Bulgana on the Western Renewables Link to Dinawan on Project EnergyConnect as the preferred option. AEMO ran the feedback loop against the 2023 IASR and the Draft 2024 ISP in December 2023 and confirmed the project remained on the optimal development path, and the AER approved the Stage 1 early works contingent project application in May 2024.
The project has been retained as actionable in the 2024 and 2026 ISPs. Over that period the Victorian route has moved, the delivery vehicle has changed, and the cost estimate has risen from a little under $4.0 billion at the time of the Stage 1 application to $7.6 billion in the 2026 ISP, carried with an accuracy range of minus 30 to plus 50 per cent.
Our method
We start from our headwinds reference case for the NEM and construct three cases for comparison.
- The first is the base case, with VNI-West delivered on its current timing in our reference case. Importantly, our reference case already assumes delays to VNI-West.
- The second is the naive removal case. We take VNI-West out of the forward plan and change nothing else – the same generation and storage build, in the same places, at the same times. This is deliberately artificial.
- The third is the re-optimised case. We take VNI-West out and let the model rebuild: generation, storage and firming are all free to respond, subject to the same build limits and connection constraints as the base case.
We report outcomes on our standard weather reference year, but also for some charts on a 2011 weather reference year. The 2011 reference year combines a harsh summer with a winter that sees sustained wind droughts across the southern states. Chart 2 explains why the choice of reference year does a great deal of the work in this analysis.
Chart 1 – The naïve price effect in Victoria, and how long it lasts
Chart 1 shows average annual spot prices in Victoria for the reference case and the naïve case without VNI-West. The two cases are indistinguishable to FY2033. They separate in FY2034, and by FY2036 the case without VNI-West is at $194 per MWh against $126 in the reference case. From that point the gap averages around $56 per MWh and never closes. It is at its widest in FY2036 and again in FY2044, at close to $70 per MWh, and at its narrowest in the mid-2040s, at around $40. In the last year of the outlook it is still $38.
Chart 1 – Removing VNI-West lifts Victorian prices by around $56 per MWh from FY2036
Average annual spot price in Victoria, reference case versus reference case excluding VNI-West
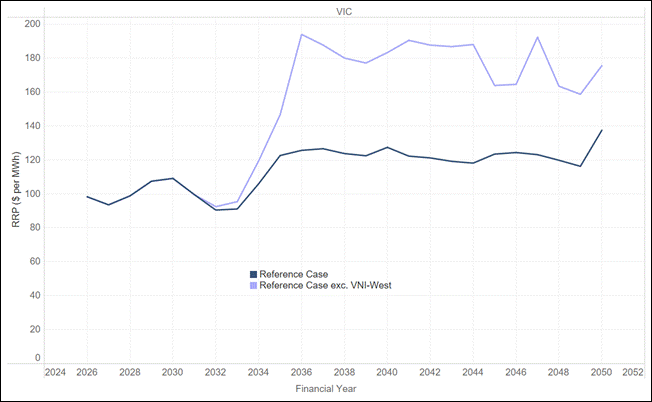
Chart 2 – Outcomes under a 2011 weather reference year
Chart 2 adds a 2011 weather reference year to both cases, giving four lines: the reference case and the case without VNI-West, each run on standard weather and on the 2011 trace. The price level rises sharply. Without VNI-West, a 2011 trace produces Victorian prices above $210 per MWh in six years of the outlook and a peak of $236 per MWh in FY2045, against $124 in the reference case on standard weather in the same year.
Chart 2 – Under a 2011 reference year the removal effect is markedly greater
Average annual spot price in Victoria, standard weather and 2011 weather reference year
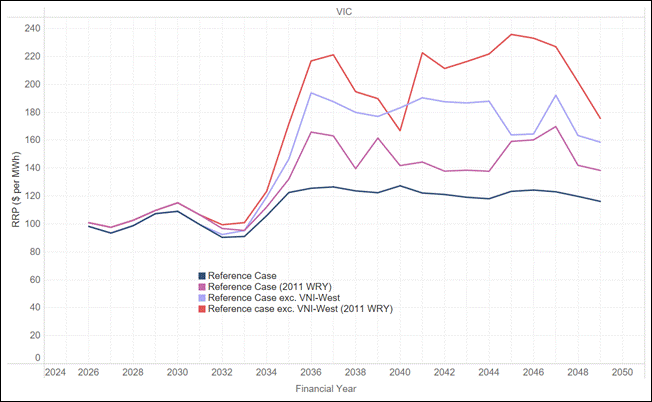
An interconnector earns its keep on a small number of days a decade, under exactly the conditions the 2011 trace reproduces, because that is when the diversity between regions is doing the heaviest lifting. Averaging across reference years does to an interconnector what averaging across a year does to a peaker: it produces a number that is arithmetically correct and analytically useless.
We made a version of this point in our November 2021 Chart of the Month on Vic-NSW. Interconnectors derive a large part of their value from the uncertainty of future outcomes, because they increase the diversity of supply options, and yet the models used to value them are typically deterministic and assume perfect foresight. If we know the future, there is no value in a hedge against uncertainty. Five years on, the models have improved at the margin, but the point still stands.
Chart 3 – This is not just a Victorian question
Chart 3 shows the same comparison across four regions. South Australia is affected almost as heavily as Victoria. Prices without VNI-West run around $50 per MWh above the reference case from FY2036 through to the mid-2040s, peaking near $168 per MWh in FY2036 against $114. Tasmania is $30 to $45 per MWh higher over the same period. New South Wales moves the other way: from the early 2040s, prices there sit some $5 to $12 per MWh below the reference case, because energy that would have moved south stays in the region.
Chart 3 – South Australia and Tasmania bear price increases nearly as large as Victoria
Average annual spot price by region, reference case versus reference case excluding VNI-West
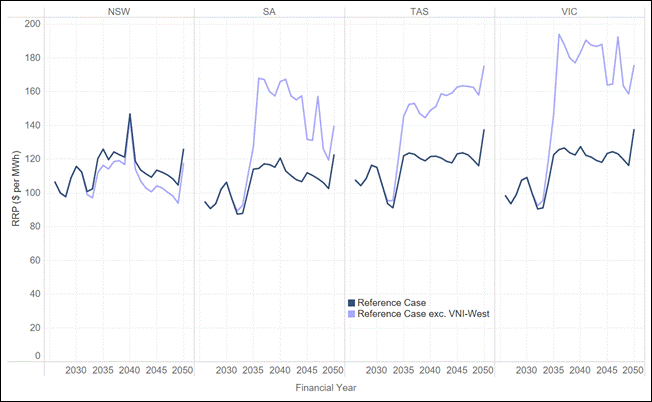
The mechanism is not complicated, but it is routinely missed. Interconnectors also affect prices in neighbouring regions, sometimes for the better and sometimes for the worse. The practical consequence is that the effects of the decision are not restricted to Victoria, and they are not symmetric. A change of $50 per MWh in South Australia is not a rounding error.
Chart 4 – What the system builds instead
We now turn to the re-optimised case. Chart 4 shows the difference in new capacity between the base case and the re-optimised case by technology and year. Bars above the line are capacity the reference case builds but the removal case does not; bars below the line are capacity built only in the case without VNI-West.
The first thing to say is that this is not a replacement. Without the network, the renewables cannot be delivered, so the model does not build them. It builds a smaller, more gas dependent fleet and runs it harder.
Chart 4 – The system does not replace VNI-West. It substitutes gas peaking and deep storage for VRE
Difference in new capacity by technology and financial year, reference case less case excluding VNI-West
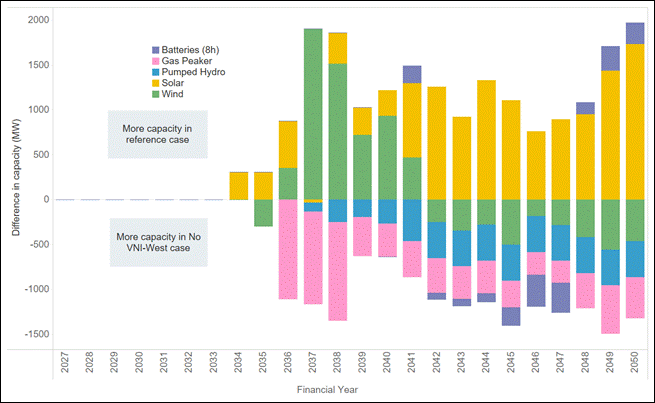
Underneath the total there is a clear substitution. Through FY2036 to FY2038 the reference case builds around 1.5 GW a year more solar and wind, while the removal case brings forward roughly 1.2 to 1.5 GW a year of gas peaking. The pattern continues with more gas and deep storage replacing more wind and solar. Interestingly the No VNI-West case builds materially more pumped hydro as it tries to firm a system that no longer has a second path to New South Wales.
The replacement is not like-for-like in either technology or location: it is gas peaking and deep storage in place of solar, wind and network, sited to reach load on the existing system rather than to reach the resource.
Chart 5 – The consequences for prices under the re-optimised case
So what does this mean for prices. Chart 5 shows the same analysis as Chart 3 but now includes prices for the re-optimised case. The important point here is that the price increases associated with the new build case persist. The reason for this is the increased use of gas for power generation in the Southern states.
Chart 5 – Even with re-optimisation the price increases persist in Victoria and Tasmania
Average annual spot prices, reference case versus re-optimised and reference case excluding VNI-West
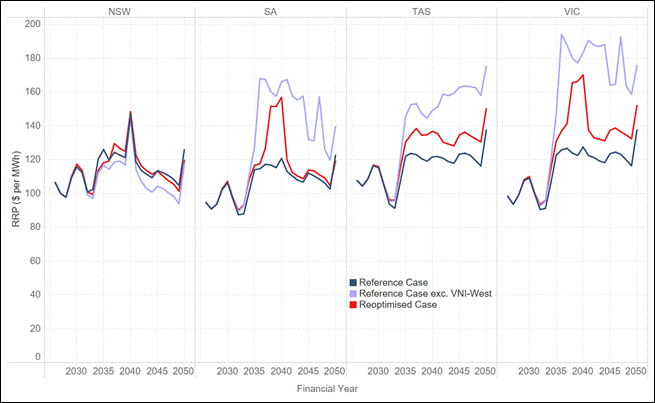
Chart 6 – The consequence for gas under the re-optimised case
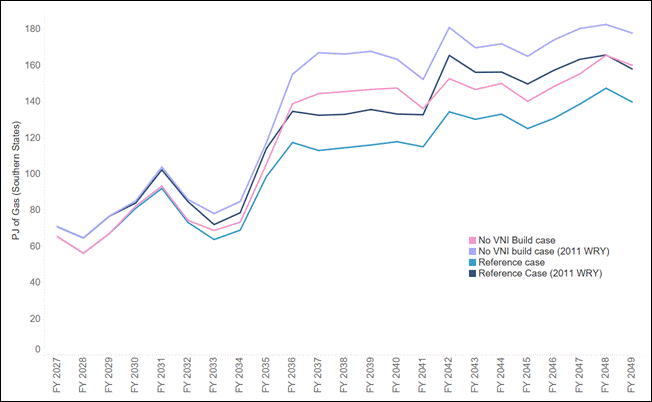
Chart 6 shows gas consumption for electricity generation in the Southern States across all four cases: reference and re-optimised, each on standard weather and on the 2011 trace. Gas burn rises by roughly 20 to 28 PJ a year from the mid-2030s onwards, an increase of between a third and a half on the reference case. The divergence opens in FY2035 and, like the price effect, does not close. The extreme weather year is when the system most needs gas, and removing the interconnector also raises the requirement.
Chart 6 – Southern states’ gas consumption rises by 25 PJ a year, more under a 2011 reference year
Gas consumption for GPG in Southern States, 2015 and 2011 weather reference years
The southern gas market is already tight. Southern supply has been declining faster than southern demand for some years, the balance is met by northern gas moved south through pipeline capacity that is fully subscribed on peak days, and it is peak-day capability rather than annual quantity that binds.
We cannot be certain whether that gas can be delivered, because much can happen in the domestic market between now and the 2030s. But we can say that it is one of the questions on which the removal case turns.
Our two cents
- The system does not replace VNI-West, it substitutes for it, and the substitution is worse. We expected the model to build its way back to something close to the reference case outcome and it does not. It leans on gas peaking and deep storage, and leaves Victorian prices around $20 per MWh higher for the rest of the outlook. Removing an asset like this from the forward plan is not a decision to avoid a capital cost. It is a decision to accept a permanently more expensive system unless something cheaper is put in its place.
- The price effect does not fade, which is unusual and which changes how the decision should be framed. In most of the work we do, a shock to the system produces a transitional price effect that closes once the build catches up. Here the build has fifteen years to catch up and does not. We are removing a key piece of strategic infrastructure from the grid. A decision framed as a saving of $7.6 billion in capital is, on these results, a decision to add tens of dollars per megawatt hour to southern prices indefinitely.
- The value of a line like VNI-West is the value of an option, but we keep measuring it as though it were a pipe. Chart 2 is revealing – the value under the 2011 weather year is markedly higher than under a median year. The value is concentrated in the tail events, and a framework that prices interconnectors on median outcomes across a scenario weighting will underprice it in a way that is superficially rigorous. This is a general problem with how we (as an industry) value network assets – not a feature of VNI-West.
- The effects are national and they are not symmetric. South Australia carries an increase of up to $30 per MWh and Tasmania up to $20 per MWh, while New South Wales is slightly better off. This shows that this is not just an issue for Victoria, but rather a consideration for all the Southern states.
- The benefit of planning certainty is itself an input to cost, and it does not appear anywhere in a RIT-T. A developer looking at any future transmission project has to price the probability that the project is unwound before it is delivered, and that probability is now visibly non-zero. A forward plan that is revisited whenever costs move or circumstances change raises the risk premium on every project that it comprises, and that premium is paid by consumers.
- Applied consistently across all future transmission projects, the RIT-T and ISP framework that has been applied to VNI-West would ultimately dispose of most of the forward transmission plan. Every major line has the same profile: costs that escalate between the PACR and the final estimate, and benefits concentrated in tail years that the central case dilutes. If that combination is sufficient to remove a project from the plan, the same logic reaches into every other major transmission project. A counterfactual worth modelling is one in which the sector builds very little new transmission at all, and each region solves its problem locally with gas. That is a coherent system with an estimable cost, and we should estimate it rather than arrive at it by accident, one project at a time.
About Endgame
Endgame Analytics is an economic and mathematical consultancy that specialises in energy. We bring expertise in optimisation, quantitative analysis, and critical thinking to solve complex problems.