


What GPG constraints would mean for WEM prices
25 August 2025: the day the SWIS hit the cap
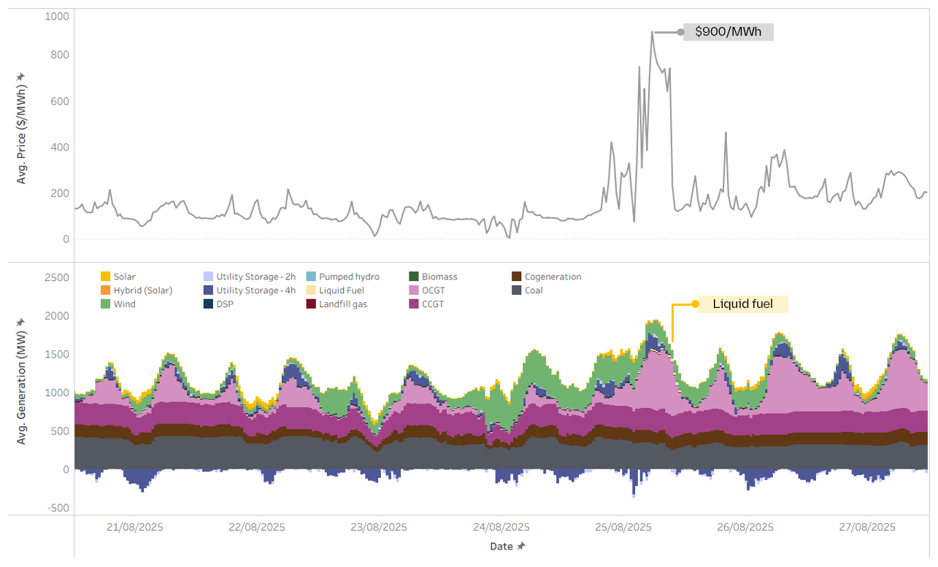
On 25 August 2025, Real-Time Market (RTM) prices reached the then market price cap of $900/MWh. A polar cold front held Perth to a maximum of 11.4°C, its coldest day in more than 50 years, and heating demand surged. At the same time, heavy cloud cover with sporadic breaks made rooftop solar generation volatile, leaving operational demand forecasts inconsistent and unstable.
The system turned to its usual answer: gas. But pipeline constraints curtailed OCGT output just when it was needed most, and liquid fuel units were brought on to cover the gap (Figure 1). Elevated daytime prices also discouraged Battery Energy Storage Systems (BESS) from charging, and their state of charge was less than 40% at the start of the ESROD period[1].
Figure 1: Average RTM price ($/MWh) and generation (MW) by technology, 21 to 27 August 2025
Source: Endgame analysis of AEMO WEM market data.
The event showed that the SWIS must withstand weather and fuel supply limits arriving together. Based on the supply conditions during the event, we estimate that gas for power generation was effectively limited to 406 TJ/day.
Repeated days like that, in a system with no coal left may bring system stress. So we asked the question: what happens to the transition if gas is constrained this way in the future?
Our reference case: SWIS Success
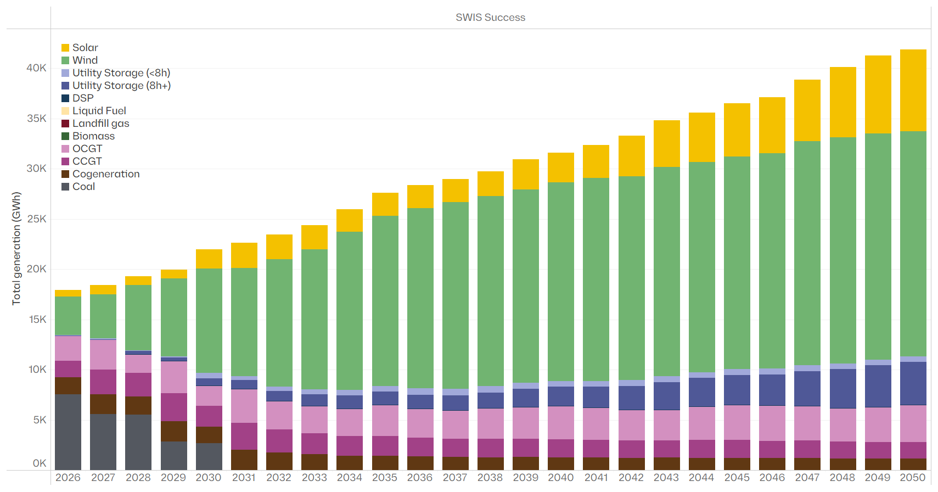
Our SWIS Success scenario describes a hopeful transition, supported by timely transmission and wind build-out. Figure 2 shows how generation changes over time. The system starts mostly with thermal plants, with coal supplying 42% of generation in CY 2026. By CY 2031, coal is retired and wind supplies most of the energy, with gas and storage firming. Solar generation slowly grows over time, peaking at 20% of generation in 2050.
Figure 2: Annual generation (GWh) by technology, SWIS Success, CY 2026 to CY 2050
Source: Endgame WEM price projection, Q3 2026.
Gas does a lot of work in this picture. In CY 2031, the first year without coal, gas-powered generation supplies around 36% of the system’s energy. Its share falls to about 20% by CY 2040, but it remains the firming resource.
Squeezing the gas
To test the daily fuel offtake constraint, we ran a Gas squeeze sensitivity on SWIS Success. Everything stays the same except for two changes. Gas available to generators is capped at 406 TJ/day, and plants can switch to liquid fuel if they have the functionality.
Over a year, 406 TJ/day is a lot of gas. The SWIS burns well under half of that for power in a typical year. So the constraint does not bite on annual volume. It bites on certain days, when demand is higher and renewable resources are lower.
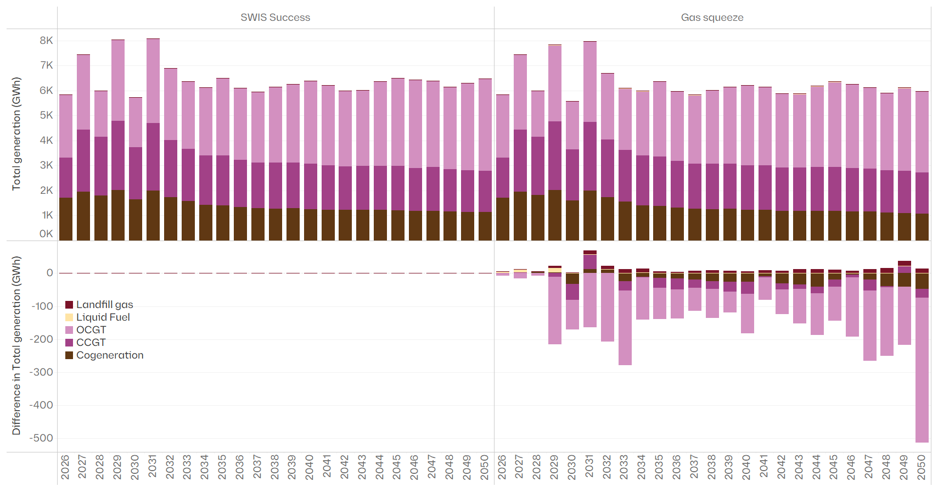
The bottom panel in Figure 3 shows how gas generation changes with the added constraint. Values below the line mean less gas generation in Gas Squeeze than in SWIS Success. From CY 2029, gas generation is lower in every year: by roughly 80 to 280 GWh a year through the 2030s and 2040s, and by more than 500 GWh in CY 2050. Most of that energy is replaced by solar and storage shifting across the day. Liquid fuel runs in CY 2026, 2027, 2029 and 2034, but never more than 13 GWh in a year.
Figure 3: Thermal generation (GWh) by technology, SWIS Success and Gas squeeze, and difference from SWIS Success
Source: Endgame WEM price projection, Q3 2026.
Small volumes, real price impact
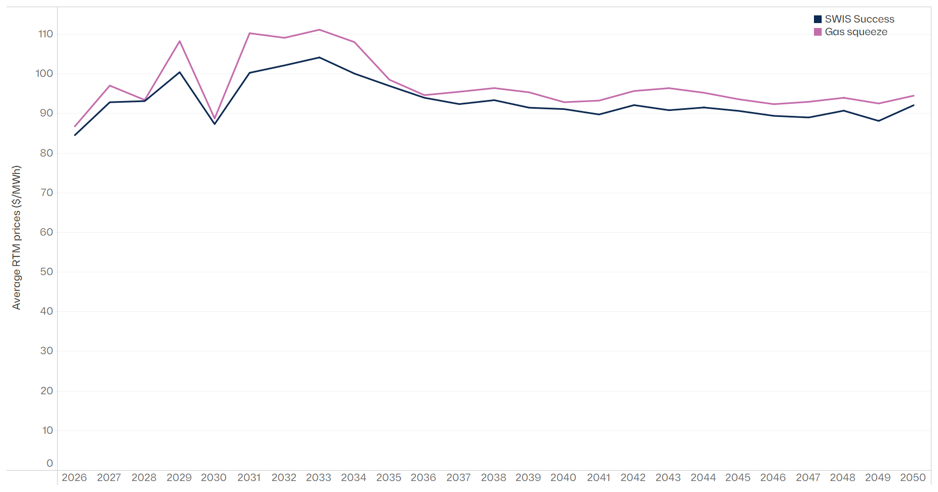
The squeeze raises average prices across the whole horizon (Figure 4). On constrained days, gas becomes scarce and more expensive resources then set the price more often; liquid fuel is called on in the tightest periods.
Figure 4: Average RTM price ($/MWh), SWIS Success and Gas squeeze, CY 2026 to CY 2050
Source: Endgame WEM price projection, Q3 2026. Time-weighted average RTM prices.
Two periods stand out:
- CY 2029 to CY 2034. The squeeze adds $7 to $10/MWh (7% to 10%) in every year except CY 2030. This is the period when coal is retiring, and gas carries the most firming. Note that in 2030, CIS projects enter as renewable generation increases and prices drop.
- CY 2037 onwards. Once new transmission projects enter, the renewable and storage fleet has matured, the increase settles at a persistent $2 to $6/MWh, averaging about $3.40/MWh.
The system copes, but it pays more to do so.
Resilience has a price
When gas is constrained, the system can’t firm renewables as well, and the SWIS has to rely on more expensive generation. Our Gas squeeze sensitivity tests one constraint, based on a real event. It does not yet test a worse renewable drought, a major outage or a more extreme weather event on top of that constraint.
As the SWIS becomes a weather-dependent system, knowing how it performs in bad conditions matters as much as knowing the central case. System planning exercises need more analysis similar to this, especially as the transition occurs.
Want to know more?
Our WEM price projection covers a range of scenarios and sensitivities. Subscribers receive the full report, a briefing, the assumptions and summary workbooks and half-hourly modelling results.
Join us at our upcoming WEM price projection seminar or get in touch.
Results are from Endgame’s Q3 2026 WEM price projection (PLEXOS dispatch model). Prices are real, time-weighted average RTM prices in 2026 dollars. CY means Capacity Year: CY 2026 runs from 1 October 2026 to 30 September 2027.
[1] AEMO, 2026 WEM ESOO, https://www.aemo.com.au/-/media/files/electricity/wem/planning_and_forecasting/esoo/2026/2026-wem-electricity-statement-of-opportunities.pdf?rev=80281c368251452c84bfa16ab4eb9fcd&sc_lang=en