


Market, machine and model – what each is telling you when the curve moves
A year ago, the New South Wales evening peak swap for Q1 2027 was marked well over $300 per MWh. By September it had more than halved. Queensland has come down a similar path, and most evenings over the year have settled well below where the curve was sitting. On the fundamentals, there is a reasonable case that prices have further to fall.
The curve stabilised over July to August and incrementally traded up in September, but then came the volatility of October, and the front of the curve stepped up. By the 20 October close, the Q1 2027 swap was back above $180.
That is the reality of trading a forward curve. A trend can run for months and reverse in days, and the models most of us use to judge whether that trend is fair don’t reverse with it. Against this backdrop, we ask: when the forward curve, a machine-learning forecast and a fundamental model all disagree, what is the gap telling you?
To answer it, we have put three sources on one chart.
pd4castr is Endgame’s machine-learning price forecast, and Prisma is our fundamental model of the NEM. We have combined these two sources with observable market pricing across the forward curve, provided by TOD Markets.
TOD Markets operates an ASIC-licensed, real-time electronic over-the-counter (OTC) derivatives marketplace for Time-of-Day electricity swaps in the National Electricity Market (NEM), publishing daily closing prices and facilitating two-way markets across a range of regional, quarterly and Time-of-Day contracts. These products enable generators, retailers, battery operators and trading firms to manage electricity price exposure across different periods of the day, complementing traditional flat electricity futures.
TOD Markets brings together major Australian electricity market participants, financial institutions and trading firms, providing observable market pricing across the forward curve.
Chart 1 – Three data sources, one chart
Chart 1 shows the New South Wales evening peak at the 20 October close. There is a lot on it, so by way of explanation:
- Left of ‘today’, each coloured line is a quarterly swap’s daily close on TOD Markets. Dots mark the sessions where a trade went through.
- Right of ‘today’, the thick bars are the same swaps, held flat across their delivery quarter.
- The thin lines are daily prices: AEMO’s settled outcomes to date, then the pd4castr forecast (dark grey) and Prisma (teal).
- The dotted lines are the pd4castr forecast averaged over each quarter, so they can be read directly against the swaps.
- The whiskers show each model re-run against different years of historical weather.
Chart 1 – In the NSW evening peak, the market sits above the forecast in every quarter
TOD Markets closes and traded swaps, AEMO settled prices, pd4castr and Prisma, NSW evening peak, at the 20 October 2026 close
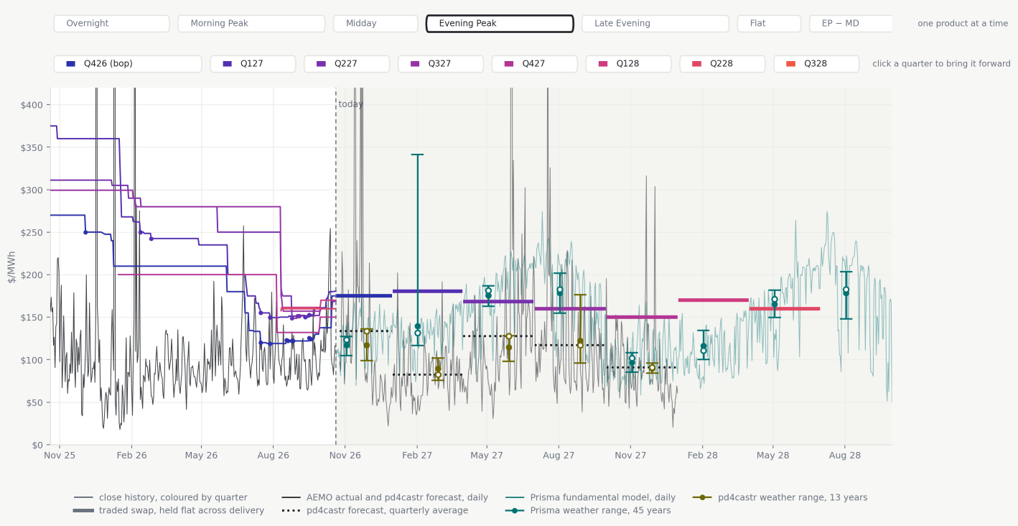
The first thing that jumps out is that the market sits above the forecast in every quarter the forecast covers. Across all three regions it is the same story for four products in five. The rest of this article is about why.
Chart 2 – The market leaves a trail
TOD Markets prices each part of the day separately: five prices for every quarter, where a conventional swap gives you one. That matters because exposures aren’t flat. A solar farm is long the middle of the day and a retailer is short the evening peak. They are carrying opposite halves of the same quarter, and a single blended price gives neither of them anything to hedge against. The same granularity lets a battery owner trade the midday-to-evening spread directly. TOD Markets also provides this data as a service for businesses that do not trade.
Chart 2 strips everything back to the closes. The curve came down in steps through 2026 as a year of soft spot prices worked its way in. Trades are sparse – fewer than one close in a hundred carried one – so a flat run usually means no news rather than a steady price. A close only moves when someone bids or offers through it.
Chart 2 – NSW evening peak swaps roughly halved over the year, then reversed in October
TOD Markets daily closes by delivery quarter, NSW evening peak, to 20 October 2026; dots mark sessions with a trade
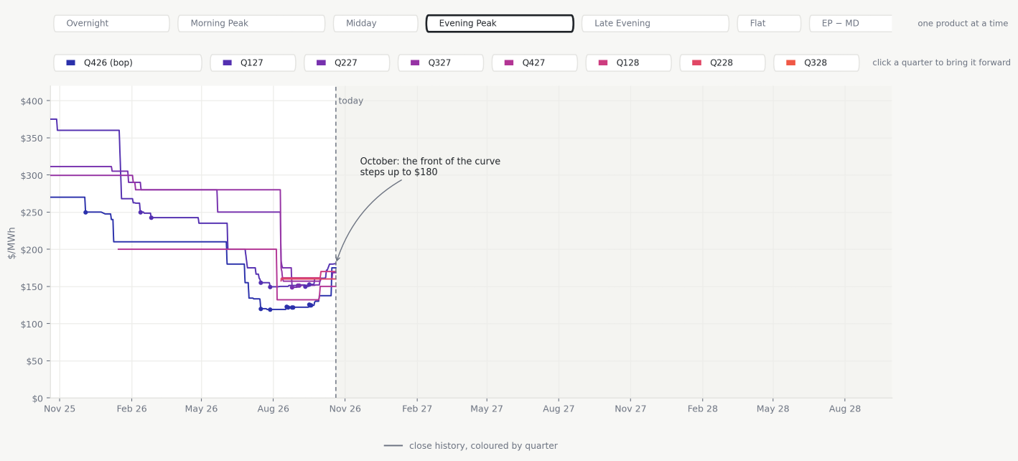
Put another way, a market price is the end of a journey. A model forecast starts afresh every time it runs with different inputs. A forward curve must move from where it last traded, and it carries its history with it: the positions people hold, the losses they have taken, and how nervous they feel about the next one. In October that nervousness came back, and the curve stepped up with it.
So what changed on 1 October? Here we are speculating, but we think the curve simply fell too far. More storage and renewables are on the way, and that is what the downtrend was pricing. The cost of producing energy has not fallen with it. Coal is priced off export parity, and gas earns more on a ship than in a power station. By September, swaps had reached a level where some NSW generators no longer wanted to sell them. It paid better to buy contracts instead, pass the cost of their plant through to the spot market, and lift revenue by bidding higher.
Then, on 1 October, unit outages and changes in contract positions landed together at the turn of the quarter, and ran on into the next one. Add some unseasonably hot weather, and the curve stepped up to meet them. This was not a wobble. It was the market resetting to a new fundamental level.
The charts now show it. NSW evening peaks have settled at around $134 per MWh so far in October, up from $92 in September, with three straight evenings above $200 in the second week. The Q4 swap sat at $137.50 right through those evenings, then re-marked to $175 on 15 October – and stayed there as spot fell back below $100 over the following days. That is what a new level looks like on the screen: the price stops coming back.
The question is whether it persists. Outages end, contract books get rebuilt and storage keeps arriving, and all of that pulls the curve back down. But fuel costs set by export markets are not going away, and a generator that has found it earns more in the spot market than on the screen will be in no hurry to start selling again. We expect the market to spend the next quarter testing which of those forces wins.
Chart 3 – The forecast follows recent behaviour
pd4castr isn’t trained on raw price history in the hope the pattern repeats. It is trained on two years of history, matching what was forecast at the time against the prices that actually settled, and it learns from a small set of explanatory inputs: demand, renewable output and, above all, how much scheduled plant is sitting in reserve. Some of those inputs are calculated from known relationships before the model ever sees them, rather than learned from a handful of examples. Refining those inputs is where we put most of our effort.
Looking forward, demand is built from a single reference year of weather, and plant availability comes from AEMO’s MTPASA, adjusted for the outages generators are likely to take so it matches the eight-day lead time the model was trained on. What comes out is the price you would expect if participants keep bidding as they did over the training period. Bidding behaviour, gas costs and network constraints are not modelled directly. The model only learns about a change like 1 October once the new prices have settled and worked their way into training.
That makes it the best guide we have to the next few quarters while the market behaves as it has – and it means the forecast has followed the spot market down.
The dotted lines on Chart 3 average the forecast over each quarter, and they tell an interesting story. Plant availability is the model’s main input, so it is reading the same Q4 outages through MTPASA. Its average for the rest of Q4 is $134 per MWh – almost exactly what October has settled at so far. Then it drops to $83 in Q1 2027. The forecast agrees that Q4 is different. It just doesn’t think it lasts. The market, holding Q1 2027 above $180, does.
Chart 3 – The forecast lifts for Q4, then falls away in 2027 while the curve holds
AEMO settled prices and pd4castr daily forecast with quarterly averages (dotted), TOD Markets closes and traded swaps, NSW evening peak, at the 20 October 2026 close
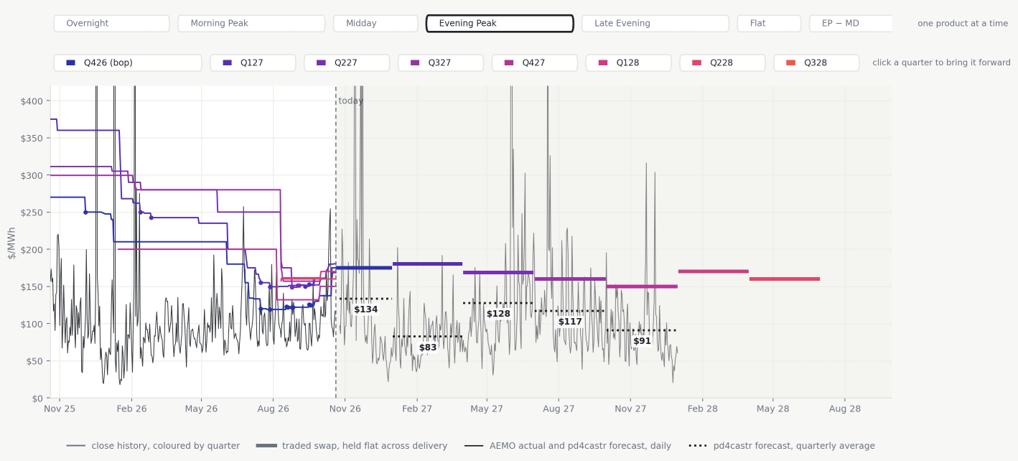
We don’t read the gap as the forecast being wrong. The forecast is answering ‘what will this cost if the market behaves as it has?’ The market is answering ‘what will I pay so I don’t have to find out?’ After a year of evening price spikes, the second answer carries a premium – and October has just reminded everyone why.
Chart 4 – The fundamentals show where the system should head
Prisma comes at the problem from the other end. It is a capacity-expansion model: it builds the system from costs and assumptions about plant, fuel, demand and new entry, and calculates the prices that fall out. It has no idea what traded yesterday, and that is its strength. It tells you where prices should head as the system changes, and what any one assumption is worth.
Chart 4 – Prisma sits below the market in most quarters, but above it through the winters of 2027 and 2028
Prisma daily prices, averaged over the same delivery window and hours as each swap, NSW evening peak, at the 20 October 2026 close
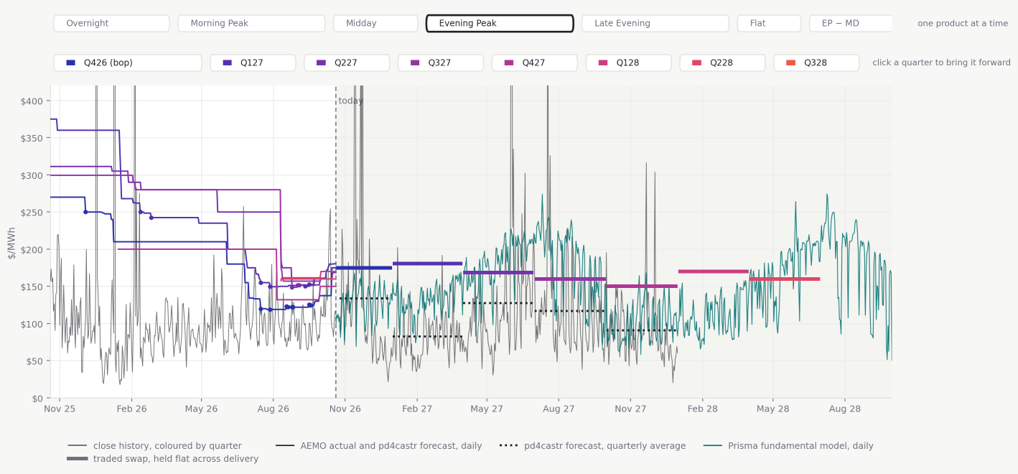
Prisma is no permabear – through the winters of 2027 and 2028 it sits above the screen. But in most quarters it sits below it, alongside the forecast. When a model built from costs, Prisma, and a model built from behaviour, pd4castr, both land under the market, the market is pricing something neither of them carries: current fuel costs, outages and how participants are contracted.
Chart 5 – It isn’t the weather
The obvious objection is the weather. Most forecasts assume a single year of weather – 2015 is the usual choice – and perhaps a hotter, stiller year would close the gap. So we re-ran both models against every year of history we have: 45 years for Prisma and 13 for pd4castr. Each whisker on Chart 5 is that range.
Chart 5 – Re-running every weather year does not close the gap to the market
Range of each model across historical weather years; filled dot is the mean, hollow dot is 2015, NSW evening peak
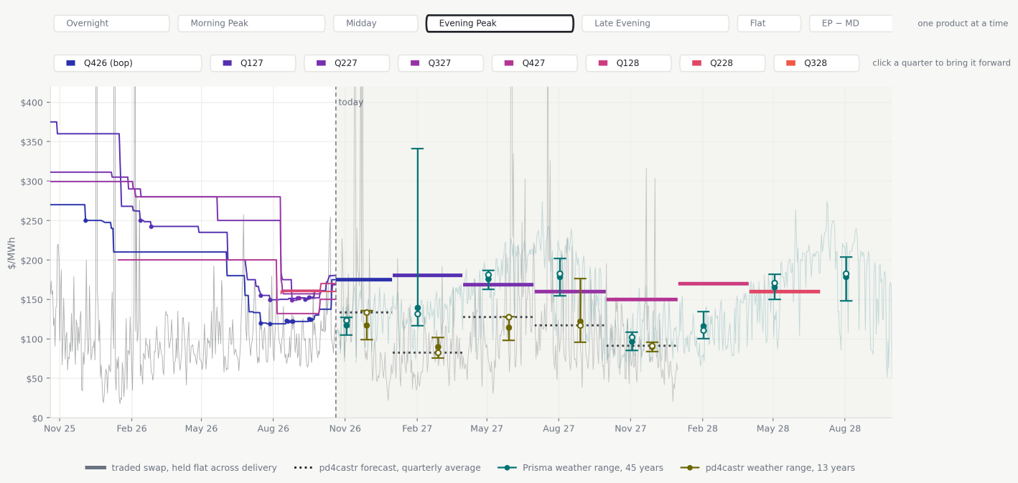
It doesn’t close. Across every region and product we looked at, around half of the traded prices sit outside every weather year that either model can produce. Whatever separates the models from the market, it isn’t the weather.
Two other results surprised us. First, which run you pick matters more than which year: for around one product in five, a single sensitivity switch moves the forecast further than the entire weather range. Second, a single weather year hides its own error. 2015 sits above the long-run average on some contracts and below it on others, with no consistent bias to correct for. Our view is simple: a forecast quoted without its run and its range is a rumour.
Chart 6 – The shape of the day
Chart 6 lines up all three sources by time of day, and it shows the most consistent pattern in the whole exercise. Prisma carves the deepest shape, with a midday trough down towards zero and a sharp evening peak: which is what you would expect from a model that builds dispatch from the plant up. pd4castr smooths much of that shape away. And the market charges most for the evening.
Chart 6 – The market prices the evening peak above both models
TOD Markets closes, Prisma and pd4castr by time-of-day product, NSW, selected quarters, at the 20 October 2026 close
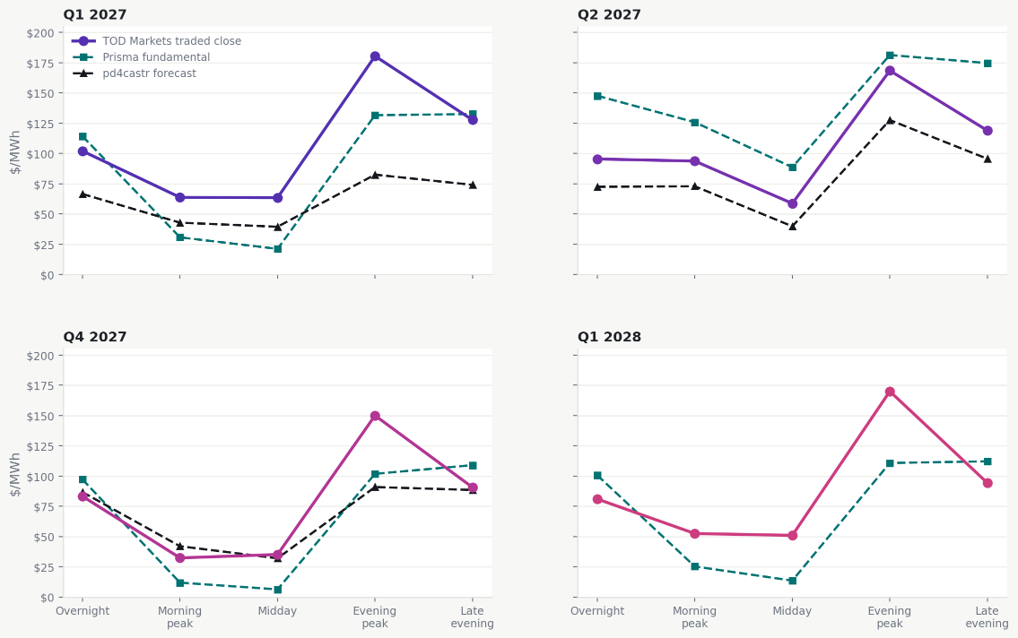
In Q1 2027 the market’s evening peak sits about $100 per MWh above the forecast, and around $50 above Prisma. At midday it sits well above the fundamentals, unwilling to bank the full depth of the solar trough. The market is buying insurance on the evening and declining to bet on the middle of the day.
That is exactly where traders feel the risk, and exactly where TOD Markets’ five prices earn their keep. It is also where both our long-run techniques are weakest. The days that hurt are made in a handful of intervals with binding constraints, unit outages, the exercise of market power. A capacity-expansion model was built to answer what gets built over decades, and a statistical model averages those intervals away.
This is the gap Gambit is being built to close. Gambit is Endgame’s short-run fundamental model, running on a replica of NEMDE, the dispatch engine the market actually uses, so that constraints, unit availability and bidding are represented as dispatch sees them. Rather than lean on Prisma for the near quarters, the intent is to use Gambit to change the inputs that moved the market on 1 October – coal prices, outages, contract positions – and price the next few quarters directly. That gives a quick, adaptive view of plant costs, availability and portfolio positions in the window before a machine-learning model has caught up.
The availability of standardised Time-of-Day forward prices provides an important additional source of market intelligence for Australia’s electricity sector.
Combining TOD Markets‘ observable forward-market prices with Endgame’s fundamental and machine-learning forecasts allows participants to compare actual market pricing with independently modelled expectations.
As renewable generation, battery storage and changing demand patterns increasingly influence electricity prices throughout the day, this combination of transparent market price discovery and independent analytical modelling provides valuable insights for trading, hedging and investment decisions.
Our two cents
- Curves move faster than models. NSW and Queensland have come a long way down, and storage will keep pushing in that direction. But the cost of energy has a floor. Coal is priced off export parity, with bids rising to $80/MWh, and gas is the same – exporting it is far more profitable. October showed the front of the curve can step up in days when outages and unseasonably hot weather meet a market that has fallen too far.
- The gap between model and market is sentiment, current conditions the models don’t carry including coal and gas availability and price, outages and participant contracting, and where the market is trading from. It is not the weather.
- 1 October looks like a new fundamental level rather than a blip. The forecast sees Q4 at the new level and lets it go by January; the screen is betting it carries into 2027. Whether it holds depends on outages returning and contract books being rebuilt, against fuel costs that aren’t going anywhere. Watch the trail of closes – it will tell you first.
- The money is in the shape of the day. It is where the market charges most for risk, where the models disagree most, and where a single blended price tells you least. We think that is where the next few years of NEM trading will be won and lost.
- In Trading Places, the Duke brothers bet everything on a crop report they were certain of, and were cleaned out when the real number came in. Nobody needs a stolen crop report to trade the NEM. They need to know what each of their modelled numbers is and how it was built – and, on the day the curve turns against them, be ready to adapt.
Appendix: sources and caveats
Sources. TOD Markets closes and quotes, 20 October 2026, from live.todmarkets.com.au. pd4castr forecasts from api.v2.pd4castr.com.au, using pinned annual model 20260924.ANNUAL-ALL-REF-YEARS.SENS r1 on the MTPASA overstatement adjusted sensitivity, at weather reference year 2015 for the line and across its 13 weather reference years for the range. Prisma Q3 2026 runs, with the 45-year range drawn from the 1981 to 2025 weather runs. AEMO settled regional prices to 20 October 2026, averaged over the same bucket hours. Prices in AUD per MWh. Bucket hours are NEM time.
Caveats.
- Prisma is modelled in real June 2025 dollars and escalated to nominal at 2.5 per cent a year so it shares an axis with the traded curve.
- The two weather ranges cover different sets of years and are not like for like.
- Whiskers show the full range across weather years, so a single extreme year can set the top.
- The evening peak less midday spread is derived rather than separately quoted, so it carries no trade markers.
- The pd4castr quarterly average for Q4 2026 covers only the part of the quarter still to run.
- Daily values above $420 per MWh are clipped on the charts.